| 2011 | 2012 | ||||||
| Price: | 1.00 | EPS | $0.00 | $0.00 | |||
| Shares Out. (in M): | 1 | P/E | 0.0x | 0.0x | |||
| Market Cap (in $M): | 1 | P/FCF | 0.0x | 0.0x | |||
| Net Debt (in $M): | 0 | EBIT | 0 | 0 | |||
| TEV (in $M): | 0 | TEV/EBIT | 0.0x | 0.0x | |||
Sign up for free guest access to view investment idea with a 45 days delay.
Intro
At present valuations, US stocks related to residential construction, such as construction materials, home products, and homebuilders, represent strong risk/reward adjusted longs. The space is widely out of favor, with most considering the stocks dead money at best and short opportunities at worst. For example:
Consensus thought is that any recovery in residential construction is at least five years away with a host of reasons, from foreclosures to vacancies to mortgage standards, cited as negatives holding back a recovery. However, the market is underestimating 1) the scale of the underbuild in US residential construction, 2) demographic trends that favor increased housing demand over the next decade, and 3) the improved state of housing affordability and consumer credit. Instead, bears have zeroed in upon 1) the "pending foreclosure crisis," which is an exaggerated problem that will have little effect upon new housing demand, 2) the supposed "oversupply" in current housing, which runs contrary to housing statistics and uses dubious guesstimates to reach dire predictions, and 3) the troubled state of US consumers in the face of higher mortgage standards.
While the current state of residential construction is in the doldrums, 2012-2014 housing starts are unlikely to drop below the current 550k/year run rate. I believe housing starts could significantly improve and approach normalized levels greater than 1MM by 2013. Companies that have weathered the late 2000s downturn are in strong position to capitalize upon a recovery. These survivors have streamlined their business, improved operating structure, and face less competition. Further, due to low expectations and the basement level of new starts, even if housing fails to recover in the next two years, the stocks are unlikely to move materially lower on a full year basis. (Note: I am not making a call for their price action in a panicked sell off.) Residential construction stocks represent an attractive risk reward where we stand to lose little money if we are wrong and we stand to make a great deal if we are right. With the recent sell off, certain good, cash flow positive businesses are trading at attractive valuations even if housing remains repressed.
Macro Thesis
Contrary to popular conception, new housing demand has little to do with foreclosures, home prices, etc. New household formation drives new housing demand. The largest drivers of new household formation are population growth, demographic trends, and general economic conditions, such as unemployment and consumer confidence. Circularly, the biggest drag upon current US economic conditions is the dearth of residential construction, thus the housing sector and economy are in a classic Keynesian feedback loop. Once the feedback loop is broken, whether through stimulus or old fashioned animal spirits, the rebound in residential construction will be sharp as there is large "pent up" demand for housing and new housing starts are at unsustainable lows.
The Math
The basic math is that the US needs to build 1.3MM to 1.7MM homes a year, whether single family or mutli-tenant, to keep up with population growth, homes destroyed, and secondary home demand. For the last three years, including 2011 projections, housing starts have averaged ~550k/year, approximately .75MM to 1.15MM below trend. Including the below trend years of 2007 and 2008, the US will have underbuilt housing by approximately 4MM units exiting 2011. From 2000 to 2006, the US overbuilt homes by approximately 300k/year and 2.1MM in total. Including manufactured houses delivered from 2000-2010 of 1.4MM, the total overbuild was approximately 3.5MM versus an underbuild of 4MM. In a "normalized" housing environment, the US would actually be experiencing a shortage. Further, the 10 year housing start total from 2002 to 2011, which encompasses both the bubble and crash, will be the second lowest 10 year housing start total in any 10 year period since the 1960s, when the population of the United States was 40% less. If there is a large oversupply, when were all these excess homes built?
Why then does the vacancy rate remain elevated? The trouble lies with the anemic pace of net new household formation over the last three years. From 2008 to 2010, new household formation averaged ~500k/year versus ~1.2MM/year from 2000-2007. The biggest drivers behind this shift are 1) the decrease in young adults living alone/away from their parents, 2) an increase in "doubling up" among families, and 3) a sharp slowdown in immigration. Some of this is attributable to structural changes; for instance, rising incomes in the emerging markets have kept many potential immigrants at home while at the same time the US has clamped down on illegal immigration. However, I believe the main driver behind low household formation is unemployment, thus the dearth in new household formation is mainly a cyclical issue. Young adults still prefer to live away from their parents or with fewer roommates, as shown in surveys and the significant increase in young adults living alone if they are fully employed. Households that previously lived separately but are currently "doubling up" presumably aspire to live alone again. Further, while the change in immigration could prove more structural, the demographic shift from the "Baby Bust" generation to the "Echo Baby Boom" generation, who will be the largest generation of Americans to ever form households, should more than offset any slowdown in immigration. (Note: For a more detailed explanation of the Echo Baby Boom, please see the JCHS 2011 State of Housing report.)
I believe the below trend new household formation represents pent up demand for housing. The US Census Bureau estimates there was a 1.4MM decrease in "not doubled up" households from 2008 to 2010, a 2.2MM increase in doubled up households, and a 0.8MM increase in total households. (So 1.4MM plus 0.8MM = 2.2MM.) (Note: a "doubled up" household includes young adults living at home.) I assume that the entire 1.4MM decrease in "not doubled up" households represents pent up demand. Approximately 77% of all households were "not doubled up" in 2008, so I assume 77%, or 0.6MM, of the 0.8MM increase in overall households that chose to double up also represents pent up demand. Thus I estimate pent up demand for housing currently living in "doubled up" housing at 2.0MM. Interestingly, this roughly corresponds with the difference between trend household growth and population growth, as illustrated here:
Now we must estimate the number of "excess" vacant houses. I will explain this further in a subsequent section, but estimating vacancies is more art than science. Most sell side analysts and housing experts put the total number of excess vacancies between 1.5MM and 3MM, with some very bearish analysts at 5MM. I do not think a model of housing starts versus new household formation versus inventories will be an accurate forecasting tool; although, humorously, I do indulge traditional methods and provide one at the end of this report. However, I believe underbuilding by 1MM units a year with 2.0MM in pent up demand versus 1.5MM to 3MM in excess vacancies sets the stage for a large rebound in housing in the next two years.
NOTE: I do not adjust my forecast for manufactured homes. While it would be technically more accurate, I believe macroeconomic forecasts in general have wide margins of error, so I have crudely swept manufactured housing into a "fudge factor." Manufactured homes delivered run at about 50k a year currently and have declined year over year in every year since 2000, which is the earliest year I have data on. While they will probably return to 100-200k a year in a housing recovery, and perhaps more if consumer tastes for manufactured housing improve, in the face of 2.0MM in pent up housing and housing starts running 1MM a year below trend, I do not feel manufactured housing is a large "delta."
Foreclosures
The media has heavily covered the "pending foreclosure crisis" yet the concept remains poorly defined. Bearish estimates for future foreclosures range as high as 11MM, or roughly 20% of total mortgages outstanding. However, I believe the consensus overestimates the threat foreclosures pose to a rebound in residential construction because 1) foreclosures have little effect upon net demand for housing units, 2) foreclosures are a clustered problem that disproportionately affect certain regions, and 3) the dire foreclosure forecasts are overblown.
Foreclosures in and of themselves are unlikely to have a serious effect upon housing demand and residential construction. Their greater effect is upon consumer sentiment, which then affects housing demand. However, I believe this headwind is manageable and dwarfed by pent up demand and the ongoing underbuild.
Excess Vacancies
To estimate excess vacancies, which in theory represent housing that must be burnt off before residential construction rebounds, one must estimate the normalized number of vacancies. This is easier said than done. Vacancies must be adjusted for the changes in secondary home demand, rental/sales mix, etc. The simple math is that there are approximately 19MM vacant homes which are approximately 14.3% of all housing units. (All numbers are from the US Census.) From 2001-2003, the vacancy rate was ~12%. Applying this 12% vacancy rate, I arrive at approximately 3.1MM excess vacancies. However, vacancy rates are dynamic, not static. The overall vacancy rate has been rising ever since the data collection began in the 1960s, presumably as society became wealthier and demanded more second homes:
What will the normalized vacancy rate be going forward? Will Americans, shocked from the housing collapse, decrease future demands for vacation homes? Will the aging Baby Boomers trade down from one large home to two smaller homes (say one in New Jersey and one in Florida), thus boosting demand for second homes? Will Americans, perhaps as a result of the foreclosure crisis, shift more towards renting from owning, which would boost the overall vacancy rate as the vacancy rate for homes held for renting is 6x the vacancy rate for homes held for ownership?
There are numerous moving parts to the story, but I am comfortable that 3MM in excess housing is a sufficiently conservative estimate, as I believe the demographic trends of the aging Baby Boomers and the shift towards rental housing outweigh any negative change in preferences towards second homes. A less conservative normalized vacancy rate estimate, say 12.5-13%, would yield 1.7MM to 2.4MM, which is against a backdrop of approximately 1MM new households being formed a year in excess of new housing starts and 2.0MM in pent up demand. Further, there is no causal connection between a normalized vacancy rate and housing starts nor is the correlation between the two (-0.35) particularly significant.
I do not believe an analysis of normalized vs. excess vacancies is likely to be useful for purposes of timing the rebound in residential construction. However, for arguments sake, I have attached my own using household growth expectations versus estimated excess vacancies. It can be found at the end of this report. It concludes that the excess supply will be exhausted between 2012 and 2014, without any contribution from the 2.0MM in pent up demand.
As an aside, these arguments circle back to a key point: If there is excess housing, when were all these homes built? The 10 year total of housing starts is on pace to be the 2nd lowest since the 1960s, despite a doubling of the population.
Housing Affordability
An often cited bear argument is that consumers can no longer afford homes. While this should actually have little effect upon total residential construction, as it would just result in a shift towards rentals, I do not believe this is true. After falling over 35% in five years, housing affordability has returned to its normal range as measured versus income and rent:
Housing is even more affordable when low interest rates are taken into consideration, such as the NAR Housing Affordability Index (which is admittedly a biased indicator):
Why then do the bears believe consumers cannot purchase a home? Bears point to a lack of household savings, troubles in retirement planning, and the lack of mortgage availability.
A July 2011 PIMCO report argued consumers lack the savings to afford down payments now that lending standards have returned to 20% down and 5% closing costs. As evidence, they cite a median house price of $158,700, yielding a down payment plus closing costs of $39,667 versus the average liquid savings of an American under age 45 of $22,600. This would be a salient argument... If it weren't for the fact that the overwhelming majority of homes are purchased by two or more people (i.e. - a married or cohabiting couple), thus by PIMCO's own math the median household can afford the down payment on the median home. For further analysis, I recreated PIMCO's model using Federal Reserve and US Census stats. I have attached the results at the end of this report. I conclude that the median household headed by an adult between 35-44 years old can afford the down payment on the median house with between $76,000 and $132,000 in excess savings while households headed by someone under 35 years old are $10,000 to $20,000 short in savings.
Regarding retirement savings, while the steep decline in global asset prices has hurt almost all US households, households approaching retirement (those aged 55-65 years old) are the wealthiest generation ever to retire. Furthermore, this first cusp of the Baby Boomers purchased their first home before the sharp run up in home prices from 2002-2006. The pullback in prices may have reduced their feelings of wealth, but it should not have a disastrous effect upon retirement savings, as opposed to those who went from renting to owning in that time frame and are deep underwater on their first purchase. I believe demand for second houses will actually increase over the next decade as the Baby Boomers retire.
In my opinion, the bears' most convincing argument is the general lack of mortgage availability. The mortgage issuance market remains a mess. While many believe Fannie's and Freddie's influence should be curtailed, private lenders as a whole lack the capital to fill the gap the two mortgage giants would leave. There are various regulatory ideas out there to increase mortgage lending, such as Fannie and Freddie buying NPLs from banks and issuing preferreds to fill the capital gaps. While great uncertainty remains, I believe Fannie and Freddie, in some form or another, will remain an integral part of the mortgage market for years to come; there is no viable alternative. Further, mortgage demand remains weak, falling to mid 1990s levels:
Currently, refinancing makes up roughly 75% of total mortgage application. While the mortgage market seems stuck, it is stuck on both sides. If the demand side were to heat up, such as a boom in housing this report predicts, lending may prove more available than currently believed.
Comparative Studies
What follows are comparative studies between the current US housing bubble and subsequent collapse and two previous ones: Japan in the 1980-1990s and the US in the 1920-1930s.
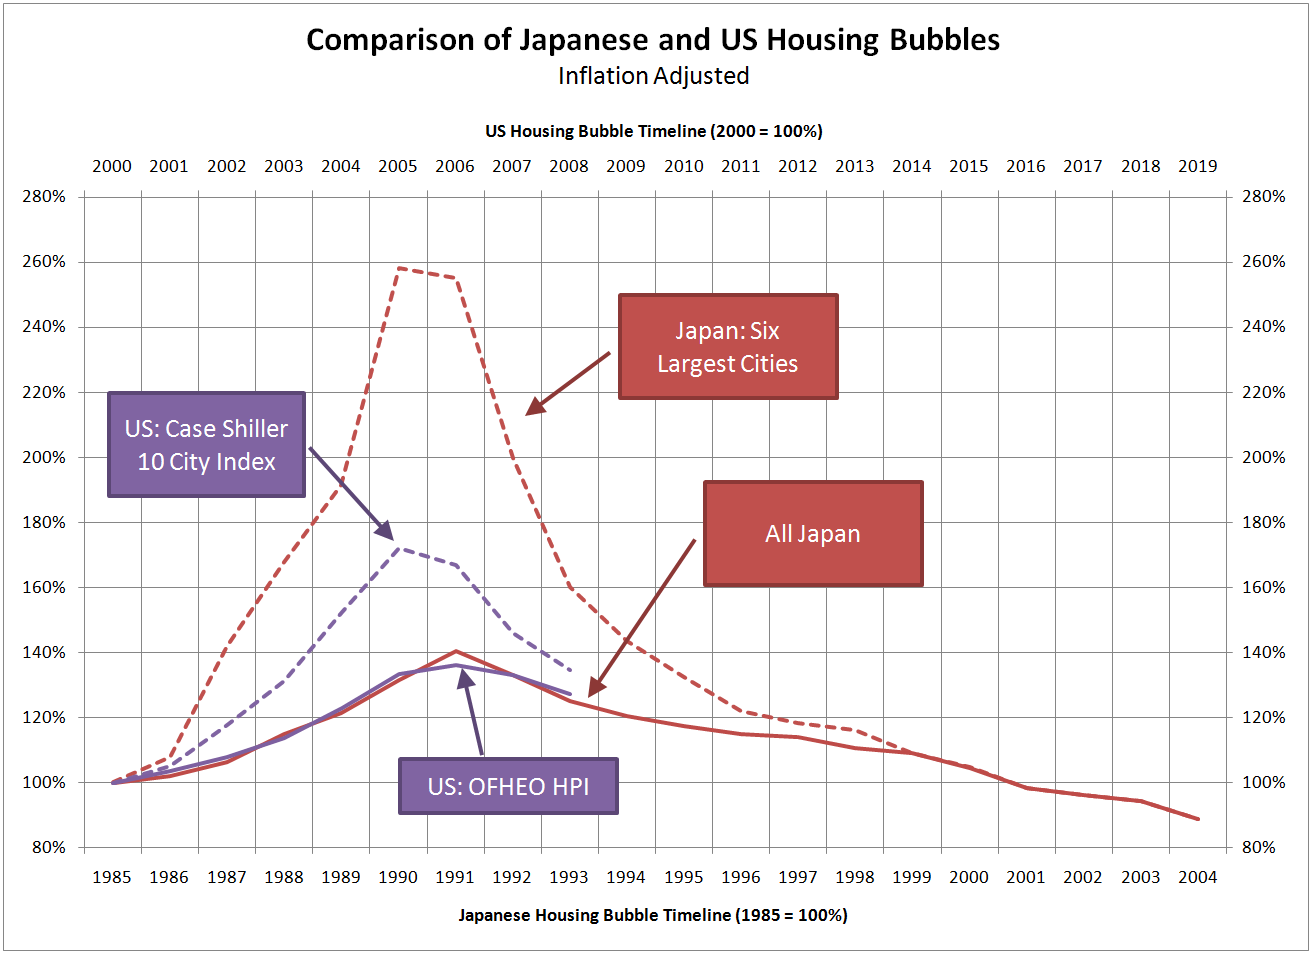
Japan
The 1980s were the high day of the Japanese growth story. Most Japanese assets soared, and home prices were no exception.
This chart, which if extrapolated forward shows US housing has continued to slide, paints a potentially dire picture for US home prices over the next decade. However, I would argue there are two key differences between deflationary Japanese housing in the 1990s and the current US housing market:
1) the US population is growing at a greater rate than Japan's did and, more importantly, 2) housing starts in the US have collapsed since the market peak in 2006 while Japanese housing starts were unchanged to higher for the first five to eight years of their housing collapse.
The United States population growth, through higher birth rates and more lenient immigration policy, has consistently outpaced Japanese growth over the past three decades.
Thus the US is better suited to deal with a housing overbuild simply by population growth.
The particularly striking difference in the response of the US and Japan to similar housing bubbles is their respective pace of housing starts. The United States has allowed residential construction to effectively collapse while Japan continued to build homes at the same pace it had in the 1980s.
Continued production despite oversupply and collapsing pricing is a recipe for further deflation. It was not until the early 2000s, when Japanese housing starts finally contracted, that the Japanese market stabilized. In contrast, US housing starts have effectively collapsed. US Residential Fixed Investment and Total Fixed Investment are running at 2.6% and 15.9% of GDP versus the previous 20 year averages of 4.5% and 19.1%, respectively.
It is important to note that historical and cross country studies such as these are imperfect science. For instance, Japanese real estate prices reflect more land value than home value. The general reason is Japanese homes only last 20-25 years, while homes in the US often last more than 50. While the comparison is imperfect, a general conclusion can be drawn. When the Japanese bubble burst, it took a decade for residential construction to seriously contract; in the US, it took a year. I believe the US is unlikely to experience a Japan-esque drawn out housing slide because the US allowed residential construction to collapse and the excess of the bubble to correct.
The US in the 1930s
The Roaring Twenties witnessed a massive housing boom in the United States. For comparative purposes, I have taken the Bureau of Labor Statistics housing data from the 1920-1930s and adjusted the numbers for population growth. While crude, some adjustment is necessary to account for the threefold increase in the US population. Further, typical household size was considerably larger in the 1920s and 1930s as families had more children and young adults, particularly women, did not create new households until marriage. I believe my comparison likely understates the overbuild in the 1920s and is sufficiently conservative. As can be seen below, both the overbuild in the 1920s and the collapse in the 1930s were significantly larger than the 2000s. (Note: All Housing Start Numbers are in '000s.)
Population adjusted, there were four years in the 1920s that were 25% over the highest year in the 2000s. The lowest housing starts number from the Great Depression was 230k versus 554k in 2009. The 1930s low was reached with unemployment at 25% and the Dow Jones losing 89% of its value versus 10.1% and 53% at the bottom in 2009, respectively. Further, the 1930s housing starts contraction lasted only five or six years before turning in 1933. (Note: While I don't believe this is necessarily predictive, the timeline would equate 1933 with this year.) Once the market turned, it rallied sharply and improved every year from 1933 to 1941, slowing only during World War II. Of note, housing starts improved even during the recession of 1937-1938.
It is difficult, if not impossible, to make direct comparisons between the two series and I am wary of extrapolating too much. However, there are a few observations worth noting. First, both the overbuild and underbuild were significantly worse in the 1920-1930s. Second, when housing starts rebounded from their repressed levels, the recovery was sharp and strong despite macro headwinds dragging down the rest of the economy. Finally, even the Great Depression's collapse lasted only five or six years. The US is currently in year five or six of our residential construction contraction and I believe the consensus expects another five or more years until US housing starts rebound. This comparison would argue that investors are underestimating the odds of a rebound in the next two years.
There are several upcoming macro catalysts that could help spur a recovery in housing. In particular, I believe the Obama administration will do whatever it can to spur residential construction, as the dearth in residential construction is the biggest drug on unemployment and unemployment is Obama's biggest challenge to reelection.
| show sort by |
Are you sure you want to close this position US Residential Construction Equities?
By closing position, I’m notifying VIC Members that at today’s market price, I no longer am recommending this position.
Are you sure you want to Flag this idea US Residential Construction Equities for removal?
Flagging an idea indicates that the idea does not meet the standards of the club and you believe it should be removed from the site. Once a threshold has been reached the idea will be removed.
You currently do not have message posting privilages, there are 1 way you can get the privilage.
Apply for or reactivate your full membership
You can apply for full membership by submitting an investment idea of your own. Or if you are in reactivation status, you need to reactivate your full membership.
What is wrong with message, "".