| 2016 | 2017 | ||||||
| Price: | 26.15 | EPS | 0 | 0 | |||
| Shares Out. (in M): | 270 | P/E | 0 | 0 | |||
| Market Cap (in $M): | 7,071 | P/FCF | 0 | 0 | |||
| Net Debt (in $M): | 5,593 | EBIT | 0 | 0 | |||
| TEV (in $M): | 12,664 | TEV/EBIT | 0 | 0 | |||
Sign up for free guest access to view investment idea with a 45 days delay.
- MLP
- Dividend Increase
- Discount to Peers
- Commodity exposure
- None found
- BETA
- SUNOCO INC SUN 05/30/2011
- Kinetik Holdings Inc. KNTK 02/21/2024
- ENERGY TRANSFER LP ET 07/22/2022
- SHELL MIDSTREAM PARTNERS LP SHLX 07/22/2020
- TIDEWATER MIDSTREAM INFRASTR TWM. 10/08/2017
- KINDER MORGAN INC KMI 07/12/2023
- Plains All American Pipeline PAGP 11/30/2019
- POLARIS RENEWABLE ENERGY INC PIF. 02/06/2024
- HESS MIDSTREAM PRTRS LP -SPN HESM 04/17/2017
- LEGACY RESERVES INC LGCY 10/17/2018
Description
Sunoco Logistics (ticker SXL)
Description
Sunoco Logistics (SXL) is an investment idea that contains the potential to return 45-95% on growth and cash dividends over the next 18 months with the downside mitigated by a best in class suite of assets and a growing and well covered cash distribution. In addition, SXL has the potential to double or triple on a commodity recovery. SXL peaked at $51 per share in November 2014 at roughly a 3% cash yield and now trades at $26 per share and a 7.3 % cash yield. SXL’s cash dividend is 1.2x covered and is growing 10-15% YoY. SXL’s assets are primarily FERC regulated interstate oil pipelines out of the Permian, FERC regulated interstate NGL pipelines out of the Marcellus and refined product pipelines and terminals on the East Coast. In other words, you can’t really ask for better asset/geographic exposure as these areas represent the lowest cost US production for oil (Permian) and natural gas (Marcellus) as well as near monopoly standing for the refined products business. These assets are in many cases repurposed pipelines and refinery/terminal sites left over from previous energy booms dating back to 1902 (in the case of Marcus Hook) that were held by SXL’s former parent company, Sunoco. Sunoco remains one of the largest gasoline distribution companies in the US, however post a series of transactions, all of its midstream infrastructure is now under SXL. SXL’s contracts are majority long-term take-or-pay with best in class counterparties. SXL has significant announced and contracted growth projects that will support an increased cash payout over the next several years.
Why is SXL Trading Here?
-
The entire MLP space has been crushed due to the commodity collapse; SXL is no exception.
-
Increase in rates caused all yield based assets classes to gap out, at least in the short term.
-
With the pricking of the MLP bubble, investors are confused about how to value MLPs throwing relative valuation into disarray.
-
SXL’s GP and 25% of its LP units are owned by ETE/ETP. The interminable saga over the ETE/WMB deal has likely dragged SXL down with it.
Recent Industry Overview
MLPs are tax advantaged partnerships designed for natural resource infrastructure assets that actually have many fewer restrictions than REIT and BDCs (though folks often conflate these three vehicles). Still MLPs have a few unwritten rules. Namely MLPs typically pay out the majority of their cash flows in a quarterly distribution and typically use the capital markets to fund growth capital expenditures giving the market indirect approval over new projects. MLPs that do not follow these rules typically find themselves (rightly or wrongly) trading poorly; see BWP, KMI.
With the advent of large scale horizontal drilling roughly 8 years ago and the surge in hydrocarbons flowing out of Alberta, the Bakken, DJ Basin, Marcellus, Permian, Eagle Ford, et al, we’ve seen an enormous build out of US energy infrastructure with a few trends emerging in MLP land. The first trend is the rise of the mega-cap MLP such as Enterprise, Kinder Morgan and Energy Transfer. These MLPs possess(ed?) the scale necessary to build country-long pieces of energy infrastructure as well as the low cost of capital to acquire large assets. The second trend is the hiving off of previously vertically integrated energy companies into upstream/midstream or downstream/midstream components to take advantage of multiple arbitrage (midstream assets trade as high as 10-20x EBITDA, E&P/downstream assets trade at 4-8x EBITDA). The third trend is the creation of several private equity backed public MLP vehicles.
I contend that each of these trends followed investors search for yield in a low-rate environment which translated to MLP investors tendencies to use the sanctified yield+growth back of the napkin valuation methodology. Out of respect for the reader, I will not bring up central banks again in this write-up but I do want to make the point that for the past several years, most MLP investors have asked two simple questions followed by one simple short-sighted calculation. What is the MLP’s cash yield? How fast is it growing per year? Now add the two together to figure out what your annual return will be if you buy the stock.
While this yield+growth model is a useful data point to compare MLPs, it seemed to be the market’s sole focus in the MLP bull market over the past several years. MLPs traded based on the latest guidance for distribution growth rates often ignoring the quality of the underlying assets supporting the distributions, the distribution coverage ratio and the MLP’s overall balance sheet. For example at one point in 2014 SemGroup (SEMG) was trading at a 1.4% dividend yield growing at 45% per year followed by the simple calculation: 1.4% + 45% = 46.4% return per year. (!) Much of the sell-side followed this yield+growth model and despite the obviously incorrect conclusions, this simple math guided stock movements and they weren’t wrong…until they were.
The simple recipe then for companies with midstream assets of any quality read like the cooking directions on the back of a bag of rice. First start with: i) a basket of midstream assets, ii) create an MLP with a cash yield, iii) keep the GP (and IDRs) for yourself, iv) drop midstream assets into MLP over time, v) create perfect yield+growth harmony for MLP investors to do simple calculation. Fluff with a fork and serve.
This model worked for several years until investors got really spooked starting in the summer of 2015. It wasn’t oil and gas prices falling by 60% from the end of 2014 that spooked investors, though it should have been…anyone paying attention to E&P land likely got out of MLPs early in 2015. Those that did not exit, bought the dips, and told themselves that unlike E&Ps, the MLPs had fixed-fee contracts and that these fees represented only a small part of their customers’ expense base. (Note, despite having fixed fees, only the highest quality MLP contracts stipulate any minimum volume commitments (MVCs) leaving midstream assets highly exposed to actual real time E&P drilling levels. Thus many midstream assets kept their fixed fees but watched their shipments get cut in half.) The market’s views finally did change in the summer and fall of 2015 after a couple of key moments:
1) On August 5, 2015, the CEO of Plains All American, Greg Armstrong, respected for his market calls and candor took down PAA guidance, stating “I want to acknowledge that our internal forecasts incorporate a more cautious view today than they did at the beginning of 2015. Our updated outlook reflects a more conservative assessment of the impact that aggressive competition from overbuilt infrastructure in several areas could have on PAA’s margin and volume capture.”
2) On October 26, 2015, Kinder Morgan issued $1.6B of mandatory convertible preferred stock with an interest rate of 9.75% signaling to the market that the normal capital raising channels were unappealing or even worse closed to the largest equity and debt issuer in MLP land.
Shortly after issuing the convert, Kinder cut its hallowed dividend 75% in the second week of December 2015. The capital markets also seemed to be closing as debt issuance all but ceased in the early part of 2016. MLPs fell and kept falling with the Alerian MLP index closing at $8 on Feb 11, 2016, down 60% from the highs in late 2014.
In addition to Kinder, many other MLPs have recently cut their dividends or at least stopped increasing them. The trend away from paying out 100% of their cash flows leaves the MLP industry looking for a new valuation paradigm. In all this chaos looms opportunity. I believe MLPs are moving to a more standard industry and company evaluation paradigm (KMI is after all no longer an MLP but a generic C-Corp). In addition to the typical profitability, balance sheet efficiency, conversion to cash flows, growth prospects, management quality, et al, I believe the following aspects should be particularly scrutinized before investing in an MLP:
-
Asset quality (type, location, macro winds)
-
Contracts and counterparties (type, length, quality)
-
Access to capital markets (can they fund their growth plan)
SXL Overview
I believe the most useful simple comparison metrics are: price to cash flow ex-GP share, distribution coverage and debt to EBITDA levels. I believe cash flow ex-GP share is most relevant because it measures how much cash the MLP generates that is actually available to each LP unit holder regardless of whether it is paid out as a distribution. In theory I should be happy if a management team feels they can put the equity to work at attractive rates of return. Comparing this cash flow metric to distribution coverage and debt levels gives the analyst an idea about the security and growth of its distributions.
SXL trades at 12.1x LTM 12.31.15 DCF ex-GP share and 8.4x forward 2017 DCF ex-GP share. This compares to a peer group of nine other large-cap diversified MLPs (including BPL, EEP, EPD, EQM, MMP, NS, OKS, PAA, and SEP) that trade at 13.8x LTM 12.31.15 DCF ex-GP share and 11.8x forward 2017 DCF ex-GP share using sell-side data. See model below.
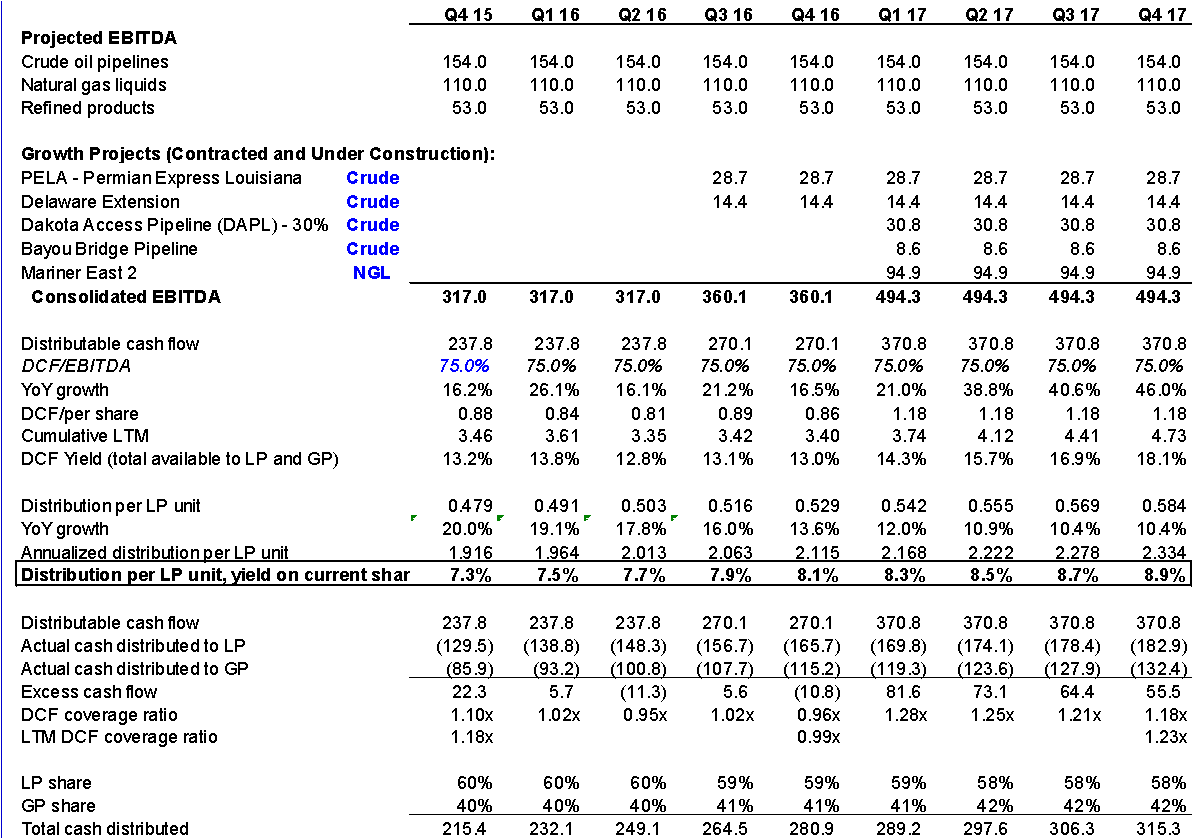
SXL’s current distribution coverage is 1.2x on an LTM basis and I model they can increase their distribution 10-15% per year and still maintain a 1.2x coverage at year end 2017 compared to 4.2% per year growth and a 1.10x coverage ratio at year end 2017 for the peer group. SXL currently has 4.9x debt/LTM EBITDA compared to 4.3x for the comp sent and I have modeled they will get down to 3.4x debt/LTM EBITDA by year end 2017 compared to 4.0x for the comp set. This reduction in debt/LTM EBITDA will occur as projects that SXL has already spent money on go into service and generate significant EBTIDA.
Using these numbers implies that SXL can easily cover its current 7.3% cash yield and support the 10-15% per annum growth rate guided by management. Under these assumptions, SXL will pay a 9% cash yield covered 1.2x at year end 2017. This compares to the peer group which currently pays a 7% distribution growing 4.2% per year which equates to a 7.6% cash yield in 2017 covered 1.10x.
To summarize, SXL is a best in class MLP trading below peers on an LTM basis and at significant discount to peers on 2017 numbers. Moreover, you can credibly argue that based on its assets, balance sheet and growth prospects, SXL should trade at premium to the peer set. Supporting this argument, SXL did in fact trade at a premium to the group for most of 2012-2015, falling many ranks within the group after the ETE/WMB deal started to go sideways in late 2015. (This is easily seen if you chart distribution yields vs peers in Bloomberg, see below).
The math for SXL works well. That said, Company management across MLP land would have you believe their math works well on paper, so to dig one level deeper, the question is what exactly makes SXL’s assets and projects so good? The simple answer is SXL inherited legacy assets that cannot be replicated located in the best geographic corridors in North America. The management team added impressive foresight to diversify into crude and NGLs as well prudently giving up some economics in exchange for demand pull, high MVC contracts.
SXL Assets by Hydrocarbon and Basin – Solid Embedded Growth
SXL’s assets can be divided up by type and basin. SXL’s crude pipelines originate in the Permian Basin in West Texas as well as the Bakken in North Dakota and terminate in refinery hubs in Texas and the Gulf Coast. SXL’s NGL pipelines originate in the Marcellus and terminate in Michigan as well as Marcus Hook, which is an area devoted to NGL storage, fractionation and exports on the North East coast in PA. Lastly, SXL’s refined product pipelines and terminals are located near major population centers in the North East, US.
Crude. SXL’s crude business in the Permian is primarily driven by the West Texas Gulf, Permian Express and Dakota Access pipelines.
West Texas Gulf is a 400k bpd pipeline that connects West Texas to East Texas and the Gulf Coast. This pipeline has been in use for over a decade and has the weakest contracts in the whole SXL family in terms of MVCs. However, it finds itself located in a critically important corridor providing the cheapest access from the Permian to three major refinery and export hubs on the Gulf Coast bypassing an unnecessary trip to Cushing (management reasons that Cushing has few refineries). The pipeline has been operating at 90% capacity for the three years through the 4th quarter of 2015 as it remains one of the better options for shippers within the most resistant basin in North America.
SXL recently put in place a 150k bpd and a 200k bpd pipeline called Permian Express I and Permian Express II that connect West Texas directly to the Gulf Coast, also bypassing Cushing. Additionally, SXL is currently constructing two 100k bpd extensions called the Delaware Basin Expansion and Permian Longview & Louisiana Extension that will extend the reach of the Permian Express system deeper into the Permian oil fields. Totaling a consolidated ~$2.5B in growth capex at a 6x EBITDA multiple, each of these projects came underwritten with, “a high majority” in minimum volume commitments (MVCs) for time periods “up to 10 years.” For those who aren’t familiar, an MVC is the same thing as a take-or-pay contract which is by the far best contract available for MLP assets. For those who correctly worry that perhaps we will soon find out how seriously customers take their MVCs, SXL recently disclosed that: “the overwhelming percentage of MVCs on the crude side are demand pull companies. We only have two supply push E&P counterparties, and both of these companies have investment grade ratings. So we believe our MVCs are secure and not subject to bankruptcy or credit risk due to the current environment challenging the crude E&P companies.” This statement confirms that the vast majority of SXL’s customers are refineries located along the Gulf Coast who tend to be in good financial shape. One further point, it also shows Company management had the good sense to contract with the dozen of large-cap refineries in lieu of the hundreds of less credit worthy E&Ps out there.
The last important piece to SXL’s crude business is a 30% interest in a new project called the Dakota Access Pipeline which is a $5B project to bring 450k bpd of crude down from the Bakken to the Gulf Coast. Energy Transfer and Phillips 66 are the other two owners of the project. The Bakken is the least competitive crude US basin but also the least served by midstream assets. According to UBS, there exists only about 750k bpd of pipeline takeaway capacity for roughly 1.2mm barrels of need. The gap is plugged by very expensive and somewhat controversial crude by rail. This pipeline will significantly fill that void. Because the Bakken is not the Permian, SXL got comfortable with this project by signing majority long-term MVCs with major IOCs.
NGLs. SXL recently put a 50k bpd ethane pipeline into service in 2013 called Mariner West and a 50k bpd ethane / 70k bpd propane pipeline into service in 2014 and 2015 called Mariner East I (both repurposed pipes). Both pipes originate in the Marcellus and transport NGLs to major storage, fractionation and export hubs. In addition, SXL is currently building an estimated $2.5B project called Mariner East II to bring 275k bpd of ethane, propane and butane to Marcus Hook which will be up and running in the first half of 2017. These projects are again backed by majority MVCs and contracted for “between 10 and 15 years,” according to management. More importantly, it is well documented that despite having the lowest production costs, the Marcellus has the lowest netbacks in North America because they lack efficient transportation out of the regions for the NGL portion of the natural gas stream. With an estimated 800k bpd of NGL demand and only 250k bpd of pipeline capacity currently on line, the question is not whether Mariner East II will run at full capacity, its whether SXL can get enough contracts signed to twin the line and double capacity while they are constructing Mariner East 2, a project they are calling Mariner East 2X which is currently in open season (discussed in SXL Options section).
Refined Products. SXL has 40 refined product terminals and 1,800 miles of pipelines located in and around the North East US. Given the relative inelastic demand for gasoline, these assets experience very little volatility year over year which can be seen if you look at the historical quarterly EBITDA for refined products. What makes these assets unique is they are located near population centers like New York City, Boston, Philadelphia, et al; areas that are very difficult to add any new energy infrastructure to giving SXL an effective monopoly. SXL did manage to add the Allegheny Access pipeline in early 2015 (again making use of legacy pipe) which was an estimated $250mm project to add 85k bpd of refined product pipeline capacity from the Marcellus to points in Western PA and Ohio.
SXL Access to Capital Markets
SXL typically funds its capex projects with 50% debt and 50% equity. The equity has come either from excess cash flow or an ATM used by the CFO to issue shares directly into the market place. SXL has between $2.5-3B of capital needs over the next two years. As of December 31, 2015, SXL had $562mm drawn on a $2.5B credit facility due March 2020 which pays a weighted average interest rate equal to 1% per annum. Historically SXL has drawn down the revolver and subsequently termed out portions of the debt when they feel there is an opportune moment to issue. They last issued senior notes on November 12, 2015: $600mm at 4.4% due 2012 and $400mm at 5.95% due 2025. SXL is currently levered 4.9x on an LTM EBITDA basis but 3.6x on the more relevant “bank covenant” basis whereby the bank annualizes the EBITDA of projects that have come online within the past year and gives a percentage of completion credit for projects partially complete. SXL is currently rated BBB and wants to keep an investment grade rating on its debt meaning a long term Debt/EBITDA goal of less than 4x.
I gain great comfort that SXL along with a conservative ATM equity issuance already has room on their revolver to fund their capex program. I gain even more comfort that SXL remains conservatively levered giving them flexibility to term out debt if/when the markets soften a bit. To support their investment grade rating, my model shows they will easily stay under 4x leverage by year end 2017 when all projects have come on line. In addition, SXL will also likely be able to support the equity component needed with excess cash flows limiting dilution.
SXL Options – Additional Growth Projects Not Included in Valuation
Should a commodity recovery occur, SXL will rally in part because the entire space will rally but also because they contain some of the best exposure to the upside through the following announced projects:
-
Crude lease acquisition and marketing segment – this segment added between $150-250mm of EBITDA years 2012, 2013 and 2014 by transporting crude opportunistically between hubs, but currently is adding near $0mm EBITDA as most of the spreads around the country compressed in 2015. (Note I contribute $0mm EBITDA for these assets in my model and valuation.) SXL calls these earnings “red-bar earnings” and never counts on these earnings to support their distribution or their capital needs which are fully supported by what they call “blue-bar earnings”. However, SXL has used these earnings in past as effectively free equity and will do so again when spreads return.
-
Permian Express 3 – SXL sized the pipe such that capacity could be doubled from 200k bpd to 400k bpd with the addition of “tankage and some pumping capabilities.” This gives the company “a low capital solution for the next time that we make a move there.” In other words, this would be a 2-3x EBITDA growth capex project and could add $150mm of EBITDA per year.
-
Mariner East 2X – SXL currently has an open season to twin the Mariner East 2 pipeline which would add an additional 275k bpd of NGL pipeline capacity form the Marcellus to the East Coast and could add up to $350mm of EBITDA per year.
-
PDH Plant – SXL is marketing a 650k ton per year propylene plant located on the East Coast at Marcus Hook to upgrade propane to a more marketable commodity. During the q3 ’15 earnings call, SXL management stated that, “we have serious interest from over 1mm tons [per year] of offtake from over 10 companies…we’re not there yet because of the pause in the overall commodity market.” This would be a $1B project and add between $125-175mm in EBITDA.
-
Should an ETE/WMB transaction occur, there are potential assets or projects in the Williams complex that might be synergistic to SXL’s projects and handed off or dropped into SXL.
SXL Risks (or Why is SXL trading here Cont.)
There is the obvious risk…what happens if commodities go down another 50% from here? There are some investors who think that’s impossible and others who think that’s inevitable or at least invest that way. If oil and gas were to trade down 50%, there is no question SXL would trade down as well. There are two ways to mitigate this risk in my opinion. The first would be to hedge the commodities…SXL gives you a nice cash distribution every year that could offset the hedge cost. The other way to mitigate the risk is to make sure you can hold the investment for a long period of time. As one of the best in class and most conservatively levered MLPs, SXL will survive another downturn and ultimately trade up significantly on any recovery in commodity prices paying you handsome cash distributions along the way. The patient investor need only sit back, collect cash and wait.
ETE owns 100% of SXL’s IDRs and ETP owns 25% of the LP units. To be honest, I have no idea what ETE could legally do to harm SXL but I have heard this “risk” from multiple folks in the industry as the ETE/WMB deal gets further into a protracted legal quagmire. I asked the CFO of SXL that question and he was equally puzzled pointing to SXL’s independent directors involved, SXL’s management team that would resign in protest and the investors that would sue. I suppose the greatest real risk is that ETE/ETP management are so distracted by the WMB transaction that they don’t take advantage of opportunities in the market place that could benefit SXL. Behavior economics would tell you that perhaps when something stinks, anything associated with it takes on that smell. But it can also create an opportunity.
Catalysts
-
A resolution to the ETE/WMB deal debacle.
-
Each increase in quarterly distribution, next announcement 4/19/16 (ex-date 5/9/16).
-
New project announcements, including those identified as upside options above.
Appendix I - SXL Model

SXL Model Continued:
Appendix II – Stock Upside

Appendix III – Bloomberg Chart - MLP Comparable Distribution Yields

I and/or others I advise hold a material investment in the issuer's securities.
Catalyst
-
A resolution to the ETE/WMB deal debacle.
-
Each increase in quarterly distribution, next announcement 4/19/16 (ex-date 5/9/16).
-
New project announcements, including those identified as upside options above.
| show sort by |