| 2016 | 2017 | ||||||
| Price: | 1.44 | EPS | 0 | 0 | |||
| Shares Out. (in M): | 51 | P/E | 0 | 0 | |||
| Market Cap (in $M): | 74 | P/FCF | 21.7 | 14.2 | |||
| Net Debt (in $M): | -7 | EBIT | 5 | 7 | |||
| TEV (in $M): | 67 | TEV/EBIT | 14.8 | 10.3 | |||
Sign up for free guest access to view investment idea with a 45 days delay.
- None found
- BETA
- QHR CORP QHRTF 08/23/2016
- Bell Atlantic/Verizon VZ 04/07/2000
- TOTAL TELCOM INC TTZ 01/05/2017
- SS&C TECHNOLOGIES HLDGS INC SSNC S 11/07/2016
- R1 RCM INC RCM 04/24/2017
- ELECTROMED INC ELMD 08/18/2022
- I3 VERTICALS INC IIIV 12/08/2021
- IES HOLDINGS INC IESC 08/15/2022
- FIRST ADVANTAGE CORP (FA) FA 09/22/2023
- STAGE STORES INC SSI 11/21/2019
Description
QHR offers an asymmetric bet with 100% upside in our base case. It has limited downside and upside even in a conservative run-off scenario using just the current revenue base.
QHR owns the single largest electronic medical records (EMR) platform in Canada. http://www.qhrtechnologies.com/
86% of QHR’s revenue base is recurring and they have 98% annual customer retention (or 2% churn). This key number highlights how sticky the product is and gives us clear visibility on the future of the business and increases the margin of uncertainty on the top line of the income statement. Additionally, we have an excellent line of sight on several high margin growth drivers in place that management is doing a good job of executing on. As the Canadian healthcare industry continues its migration from paper based record keeping to “paper-light” record keeping, QHR’s Accuro stands to benefit as the number one market share leader in Canada.
In thinking about a list of business characteristics I want in my longs, QHR checks off almost all of them; it is a high quality business, as well as easy to understand. It’s scalable, has low capital intensity, and possesses robust downside protection through a recurring revenue base. It operates in monopolistic/oligopolistic markets and has demonstrated pricing power as the product it offers is mission critical to its customers who have substantial switching costs. I’m able to conservatively forecast increasing margins and there exists some special situation elements due to the company’s recent divestitures that have had immediate and positive financial implications while creating some reporting confusion that is obscuring the strength of their underlying core EMR business. The capital structure is clean and simple and there is a new motivated CEO as a result of a recent Board shake-up by an activist investor.
QHR is recession resistant with secular tailwinds that keep it insulated from the Canadian recession that everyone has been fearing and pricing into securities for several years now. One can look to the US based EMR players to see how they performed during the Great Recession as a stress test for QHR. Spoiler alert- they grew right through it and typically cash flow and margins picked up when their growth slowed as they typically have loss leaders on new implementations like QHR does.
Lastly, I have a very clear understanding of the reasons why the stock has been depressed and believe those reasons are temporary.
Company Background
It is important to highlight the history of the company and how they devolved into a random amalgamation of disparate healthcare software acquisitions. The company was founded in 1997 and IPO’d in 2000 with an Enterprise Management Solutions and Human Resources focus. By 2012, QHR had three separately reported segments:
1) Enterprise Management Solutions (EMS/HR) –the original business
a. Enterprise Mgmt Solutions is employee centric to the healthcare provider—it’s about HR functions, such as managing employee payroll and scheduling at hospitals. There is almost no overlap between the functionality of EMS and EMR.
b. In 2013 they sold the roughly breakeven EMS division to Logibec for $20 million at a valuation of 2x sales (higher than QHR currently gets) and paid down debt.
- Transaction: Sells EMS/HR Division to Logibec
- Announce Date: Dec 9, 2013
- Close Date: Dec 19, 2013
- Proceeds: $20 mm CAD
- LTM Revenues: $10.2 mm
- LTM Adj. EBITDA: $0.4 mm
- Revenue Growth: -15%
- Note that the EMS division was sold at 2x sales (much higher multiple when considering EV/Recurring Revenue) despite massively negative revenue growth and breakeven status. We’ll come back to this in our transaction comps section as it helps highlight the absurd valuation of QHR now as a fast growing and profitable EMR pure play with the majority of revenue recurring.
2) Electronic Medical Records (EMR) via an acquisition of Accuro in 2004 (was private)
a. They’ve made 6 other EMR acquisitions since 2004.
3) Revenue Cycle Management (RCM)
a. Revenue Cycle Management software handles insurance claims processing and payment and revenue generation. RCM covers everything from patient eligibility, correctly coding claims, and collecting payments. This is generally not a great business and it is hyper competitive. Google it and you will see that there are hundreds upon hundreds of providers in the US. QHR practically gave away their US RCM segment to eliminate the $2.5mm EBITDA loss (can receive a maz $500k earnout).
- Transaction: Divests RCM Business to MTBC
- Announce Date: July 14, 2015
- Close Date: July 14, 2015
- Proceeds: $500,000 potential earn out
- LTM Revenues: $3.0 mm
- LTM Adj. EBITDA: -$2.5 mm
- Revenue Growth: 5%
Recent Shift in Strategy
QHR has evolved and undergone a change in strategy and as of July 2015, they’ve been a Canadian EMR pure play. A few months prior to the RCM divestiture the company founder and CEO was ousted. A large shareholder in Canada, Pender Funds, was partly responsible for this change, flexing its muscle behind the scenes with their 15.6% stake. As far back as 2012, Pender had been trying to get the CEO ousted, along with another fund, Broadview Capital. They were unsuccessful at the time, but persistent and have ultimately succeeded. Pender’s critique of the previous CEO was that his strategy was unfocused and his communication with investors was lacking. We agree. There is a stark difference between communication style and level of transparency between the new CEO Mike Checkley and the old CEO, Al Hilenbrandt. Pender’s motivation also stemmed from the thought that the stock would receive a higher multiple in the market as a pure play and would become a more digestable takeout target.
EMR Overview
Electronic Medical Records (EMR) are the digital documentation of those paper charts your doctor used to file by hand (ßSeinfeld clip about charts). There has been a global initiative over the last 15+ years by governments in developed countries to push doctors onto EMR platforms in order to begin collecting data electronically, as it’s believed that integrating and analyzing this data can yield both improved treatments along with cost savings for the overall healthcare system.
An integrated EMR solution will generally have three main components: the medical record itself, a patient scheduling function, and a billing function. Thus the entire workflow of the patient, from scheduling, to being seen by the doctor, to paying for the service and getting reimbursed by insurance companies, or in this case Canadian Medicare, is captured on the EMR. Ultimately, EMR is moving to the point where doctors and patients will be able to access their records anytime, anywhere. It is a complicated software program with thousands of data points and it is constantly evolving under new regulatory initiatives.
Benefits for doctors:
|
Fully document all patient records/interactions faster |
|
Benefits for administrators:
|
Use autofill e-forms for required patient forms |
|
Benefits for patients:
|
View chart info and results online |
|
QHR’s Revenue/Products Overview
QHR's recurring SAAS subscription products:
- ·Accuro EMR
- Electronic forms/charting, data storage, online patient scheduling
- Accuro Admin
- Billing, scheduling, messaging
- Accuro Mobile
- Access to all info on phone
- Accuro Patient Kiosk
- Allows patient to check in and fill out Accuro forms
QHR's one-time Services:
- Extension of the Cloud
- Dedicated Accuro server with data back-up
- Training
- Data Sharing
- Enables cross-clinic interoperability to share patients’ images
- Data Conversion
- Consulting to convert data to conform to QHR’s platforms
Canadian EMR Adoption: “Full penetration is inevitable.” – QHR Board member
-
We are in the 6th or 7th inning in terms of EMR penetration among all doctors in Canada.
-
Since 2012, Canada has moved from 56% EMR penetration to somewhere between 65-70% in 2015.
-
Many developed nations go into the mid-to-high 90’s % before penetration stalls.
-
Canada has generally lagged the US by 15% in terms of EMR penetration rate in any given year, so we view the US as a good forward proxy of what Canada’s adoption rate will look like.
For every 1% increase in adoption rate among Canada’s doctor population that is an additional 550 doctors up for grabs. So a move from 70% to 90% over the next few years would mean an additional ~11,000 available doctors in Canada for QHR to compete for.
QHR has only 19% market share in its provinces among doctors on an EMR and only 12% market share if you include doctors who are not yet using an EMR. There still exists a lot of greenfield opportunity for QHR simply from doctors getting EMR for the first time. Management claims QHR’s win rate on first time EMR adopters exceeds 25%. QHR can also grow via consolidation of smaller players who are failing to achieve scale, and taking some market share from existing vendors.
Industry Overview
The Canadian healthcare system is publicly funded and controlled by the government (called Medicare), but most healthcare is delivered privately. Every Province or Territory has slightly different regulations which will come into play when analyzing QHR.
In provinces where compliance requirements have reduced the number of vendors down to 2-3, or in provinces where the government has set a limit on the number of certified vendors, such as Saskatchewan, QHR dominates with greater than 80% market share. Three other provinces where the government has set a fixed number of certified vendors are British Columbia, Alberta, and Manitoba.
The unique certification requirements for each province pressures the regulatory compliance capability of the smallest players. The necessary R&D to keep up is partly what is causing further consolidation amongst EMR vendors. Outside of Ontario, for the most part, each province has made a concerted effort to limit the number of certified vendors.
I can’t over emphasize how crucial this fact is because it tells the story of limited supply within the industry. As emphasized in ‘Capital Returns’ (a collection of Marathon Asset Management’s letters), 90% of analysts focus the majority of their efforts on forecasting demand, but in reality it is the supply coming into an industry that will ultimately drive returns and profitability on our equity investments. This is not one of those industries where easy VC money has decimated capital discipline, rather, it is an industry with a very fixed supply so hopefully they act somewhat rationally within their consolidating oligopolies on a provincial level. The supply curve is relatively stable so I am generally comfortable that QHR can continue to compete against these other EMR providers and will continue to take and consolidate market share. As far as I am aware, Plexia is the only EMR start-up that has managed to “bust through” start-up phase and has managed to get 400 doctors. If you wanted to create a new start-up, you have to convince all the labs to work with you, for the interoperability feeds and get approved by the Provincial governments. It’s not an easy process, keeping a near term lid on number of competitors willing to absorb losses early on (e.g. VC backed—they never make money).
|
Province |
Provincial Program |
EMR Vendors |
Market Share |
|
Alberta |
Physician Office System Program (POSP) |
QHR, Nightingale, Telus, Telin, Global Biometrics |
Unknown |
|
British Columbia |
Physician Information Technology Office (PITO) |
QHR, Telus, Osler, Intrahealth |
Unknown |
|
Ontario |
OntarioMD OntarioMD Funding Eligible EMRs |
QHR, ABELSoft, Alpha Global IT, Canadian Health Systems, Telus, MD Physician Services, Nightingale, OSCAR, P&P Data, York-Med |
18% |
|
Nova Scotia |
Primary Healthcare Information Management Program (PHIM) |
QHR, Nightingale, Practimax |
Unknown |
|
Manitoba |
Manitoba eHealth |
QHR, Telus |
>80% |
|
Saskatchewan |
Saskatchewan EMR Program |
QHR, Telus |
>80% |
Drilling down on just the Ontario marketplace we find that the overall market (as defined by doctors using EMR) grew by 13% in 2015 from 2014 and QHR is growing much faster at +38% y/y (source: www.Ontariomd.ca). We can see QHR is taking market share overall. Ontario is by far QHR’s largest greenfield market opportunity. It offers the largest total addressable market outside of Quebec, where QHR does not currently operate due to the dual-language (French + English) requirements. Nova Scotia is the second greatest area of opportunity, but there are not as many doctors there. Ontario is the most fragmented, as unlike other Provinces where there are only a few vendors, Ontario has certified many companies. However, within the context of a more fragmented supply picture for Ontario, there is a silver lining. Ontario has a higher percentage of doctors on a Cloud offering and QHR is one of only three vendors who can sell Cloud based product in Ontario, with Telus and Nightingale being the other two. Why is Ontario more cloud based? The CEO told us Ontario is “a bit more mature and trendsetting” with more government resources for educating the market. They actually have about a dozen Field Reps for OntarioMD showing up at doctor’s offices to educate them about cloud based EMR and make sure they take advantage of meaningful use incentives.
Competition/Consolidation
QHR has already consolidated Bell and Jonoke, and we think QHR will continue as the most likely consolidator within Ontario. In order to understand why QHR is the most likely consolidator we need to take a look at their two largest competitors.
First, Telus. Telus has made five acquisitions in the space but they do not consolidate the different platforms into one software system. When adding up Telus’ disparate software systems, they are technically #1 in market share in Canada—QHR has the single largest share on one platform (Accuro). Telus generally goes after larger acquisitions, of which there really aren’t many left in Canada outside of QHR. Both Bell and Telus had similar strategies of getting a foot in the door of a doctor’s office with EMR and then sell them telecom services, internet, cell phone plans, etc.:
|
Company |
Year |
Number of Doctors |
Provinces |
|
Wolf Medical |
2012 |
~1,500 |
BC, Alberta |
|
KinLogix |
2012 |
~2,000 |
Quebec |
|
PS Suite |
2013 |
~4,500 |
Ontario |
|
Med Access |
2014 |
~2,000 |
BC, Alberta, Saskatchewan, Manitoba, Ontario |
|
Medesync |
2015 |
~1,000 |
Quebec |
The next largest competitor and threat to QHR is OSCAR.
-
OSCAR is Ontario based with 20% market share in that Province, but nationwide has a much lower share.
-
OSCAR is an open sourced alternative that is similar to Linux.
-
There are several different OSCAR re-sellers.
-
OSCAR does well with the smallest doctor groups that are extremely budget conscious.
|
Pros of OSCAR |
Cons of OSCAR |
▫ Collaborative ▫ Many users making improvements, collectively can be more powerful than development team |
|
Our due diligence shows that OSCAR keeps getting better and better and is “tough competition” and potentially a scarier competitor than Telus, but they are “chaotic, not as well organized.”
Doctor Growth
There are two main drivers to QHR’s visible long term growth plans.
1) Raise ARPU (partially through cross-selling additional functionality/features, which I will highlight) and
2) Increase the number of doctors subscribing to Accuro.
There is substantial opportunity for both. I think over 5-6 years their goal is to double both ARPU and the number of doctors, which would quadruple revenue. So far they are actually doing a good job of delivering tangible results. They’ve added at least 1,000 doctors per year in each of last four years and we model in 1,200 additions in our base case.
Between cheap inorganic growth, organic growth, and competitive displacement of existing vendors, adding 1,000 doctors a year to the Accuro platform is a very realistic goal, and one they easily accomplished in 2015. In their January 2015 presentation QHR claimed to have 5,550 doctors on the Accuro platform, then in the Q2 call they quoted 6,700 on the platform, implying two quarter growth of 1,200 (+22%). Another way to frame the doctor growth is that they need to add an average of 1,400 per year for the next five years to double the current revenue base.
On the recent second quarter call, the CEO also said that of new doctors they are implementing, 60% came from new paper to EMR, 30% came from “takeaways,” or competitive displacements, and 10% came from transitions from Bell. Hence 90% of the growth was organic. None of the acquired Jonoke doctors had yet moved onto the Accuro platform, but 200 of the 750 were “mid-pipe” and “qualified.” Additionally, the company has a 200 doctor backlog of implementations providing further visibility on near term growth. QHR was forced to hire additional implementation personnel (more on that in a bit) to begin rolling out the product and keep up with growth in demand.
Below is breakdown of how QHR can grow their doctor count:
|
Source of Growth |
2016 Estimate |
Comment |
|
Paper to EMR |
400 |
Assume 3.5% additional penetration, 20% win rate |
|
New Doctors |
325 |
Assume 3% doctor population growth, 20% win rate |
|
Takeaways, net |
100 |
Likely lower than 2015 (~25% of total adds) |
|
Acquired |
400 |
Jonoke, “500 in pipeline”, others possible throughout year |
|
Allied Health |
100 |
Allied Health equal in size to doctors but not as much of a focus due to lower ARPU |
|
Total |
1,325 |
1,200 in official Base Case model, 1,325 would be 17% doctor growth |
An additional point to note is that we think the 30% displacement ultimately feeds and bolsters the ~10% acquired. In other words, as QHR continues picking off doctors from smaller, struggling EMR vendors, the vendors may eventually come to QHR hoping to get taken out. A direct quote from a Board member, paraphrasing the CEO (so a second-hand quote) is “You should probably sell to me now, because if not I’m going to take your customers and then come back to you in one year from now and offer you less money.” QHR has been the primary acquirer of the smallest players. The data conversion process is complicated and they have grown to become very proficient at moving doctors off of other platforms onto their own with seamless transition and limited downtime for the practice.
Terms of QHR’s three latest acquisitions:
|
Company |
Date |
Number of Doctors |
Valuation |
Territories |
Notes |
|
Healthscreen |
9/2011 |
~1,500 |
unknown |
BC, Alberta |
In Q2 2011 QHR bought Healthscreen’s senior secured notes from a PE firm. Ultimately consummated an Asset Purchase Agreement out of bankruptcy |
|
Jonoke |
2012 |
~750 |
Free w/ $500k earnout |
Quebec |
Only 50-100 converted to Accuro so far |
|
Bell-Agreement |
2013 |
~500 |
Free w/ cross-sell agreement |
Ontario |
Bell agreed to push its customers to Accuro and QHR agreed to push Bell telecom services |
Putting together all these opportunities, combined with this years’ performance and a strong backlog/pipeline, adding 1,000 doctors a year for the next three years actually seems a bit conservative to us, and 1,000 doctors in 2016 given the strong head start from Jonoke feels particularly conservative. Our base case assumes QHR around 10,000 doctors by the end of 2018.
ARPD – Average Revenue Per Doctor Detail
|
Product Package |
Monthly Cost Per Doctor |
|
Billing or Scheduling Only |
$100 |
|
Billings/Scheduling, no EMR |
$150 |
|
Full Primary Suite (Billing, Scheduling, EMR) |
$300 |
|
Full Suite + Cloud |
$450 |
|
Full Suite + Cloud + Medeo |
$550 |
-
QHR’s strategy is to land doctor and raise ARPD over time by improving functionality.
-
The vast majority of their users utilize the full Accuro suite.
I thought it would be worthwhile to highlight one potential ARPU driver, Medeo. Medeo was founded October, 2012 and acquired by QHR in November 2014 for $2.25 million in cash and 1 million QHR shares at $1.20. Medeo is a software platform for virtual/telehealth, as well as a secure doctor messaging platform. The revenue model is a $100/month basic subscription. The CEO believes $125/month could be a medium term target with additional add-on products. At $100 Medeo would increase current the ARPD from $300 to $400, or +33%.
The company has spent all of 2015 building integration between Accuro and Medeo (which explains part of the R&D spike). They claim to have done no marketing of the product yet, but say it will be a priority in 2016. Management believes there is massive pent up demand, that a majority of their existing doctors will sign up for the product. The only hold up has been that right now only British Columbia reimburses for Telehealth visits, thus all 300 current Medeo subscribers are in BC. This is a very respectable 30% attach rate within the BC doctor base. Management says its a question of “when, not if” other provinces develop telehealth reimbursement guidelines and follow BC's lead. An additional point of note is that Medeo is HIPAA compliant, meaning it could be licensed in the US. When asked if they were planning to license the product in the US to other EMR providers I think the answer was “hell yes!” Management believes other licensing opportunities within Canada are possible; they believe they are only EMR with this type of product. Owning the EMR and having the doctor on your platform already is a natural jump-off point to cross sell Medeo. In a survey, albeit in the US, 64% of individual said they would be willing to see a doctor virtually and 70% said they would like to be able to get prescriptions via virtual visit and this is the way the world is moving.
This table shows you some scenario analysis on QHR’s overall ARPU should Medeo really gain some traction.
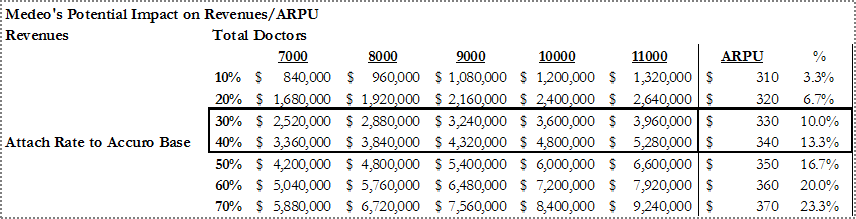
Despite limited marketing and being in inning numero uno, they are getting a 30% attachment rate within British Columbia. If they were able to achieve this across their entire doctor base and the number of docs grows over time, looking out a few years at that same 30% penetration rate, Medeo would be adding $3.2-5.3 million in high margin subscription revenue and raise the overall ARPU by 10-13% just by itself. For now we don’t model in much growth contribution from Medeo, but view it as a potential hidden call option.
Why does this opportunity exist?
First, QHR screens very poorly. It shows negative revenue growth and deteriorating profitability with a casual glance at the financials. Many retail oriented finance websites like Google Finance do not even show financials for QHR.
Even since becoming an EMR pure play, QHR EBITDA and Adjusted EBITDA look weak:
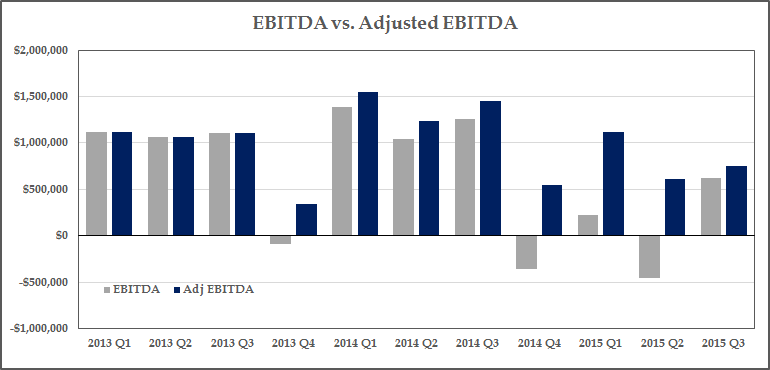
Until Q4 of 2014, the company did not even break out Adjusted EBITDA from EBITDA, as it was generally pretty close. However, subsequently the disposition of assets left increasingly wasteful overhead in place, the removal of the CEO and some board members resulted in major one time payments to executives, and the acquisition of Medeo in particular has resulted in some one time integration costs that will not be recurring.
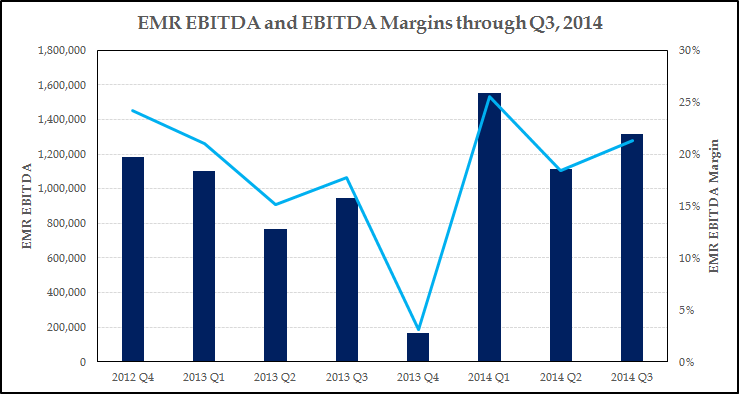
Glancing back in history at just their EMR segment, we gain additional comfort in the ultimate margin expansion possibilities to 25%+ judging from their historical EMR performance, until Q4 2014 when they stopped reporting EBITDA separately. The recurring revenue base is not much larger and margins should be able to surpass the previous 25% peak.
Here is a summary of the one-time expenses:
|
|
2014 (Q1 + Q2) |
2015 (Q1 + Q2) |
Delta |
|
Executive and Board Restructuring Charges |
154,000 |
1,358,687 |
1,204,687 |
|
Acquisition Related Expenses |
24,500 |
126,703 |
102,203 |
|
Other Restructuring |
175,000 |
480,663 |
305,663 |
|
Total One-Time Expenses |
$ 353,500 |
$ 1,966,053 |
$ 1,612,553 |
-
$1.61 million in expenses should not be recurring as restructuring is complete.
Three additional reasons for rising costs:
-
R&D has jumped from 7.5% of sales to 12% of sales in the most recent quarter
- Takeaway: Neutral/Negative.
- In the latest call the new CEO Mike Checkley talks extensively about new product development to increase cross-selling opportunities, new products off of the Medeo platform. Whether or not this jump in R&D will ultimately lead to higher revenue growth and profits is to be determined. Or is the jump in R&D necessary just to stay relevant and keep up with competition and maintain regulatory compliance? Nightingale spends ~$4.5mm on R&D a year, or >30% of sales, but has half the revenue of QHR. The need for increased R&D to maintain regulatory compliance is one of the main reasons that QHR was able to consolidate Jonoke.
- Takeaway: Neutral/Negative.
- “New Pricing Model” - lowering implementation costs to customers
- Takeaway: Negative
- The company purposefully lowered their implementation costs to increase their win rate. They refer to this in conference calls as their “New Pricing Model.” Thus we can see in the latest quarter that while recurring revenue rose 20%, professional services revenues declined 15%. As we will get into in the Valuation section, we believe they now lose $4,000 net per doctor (total cost around $6,000 and recouping about $2,000 in professional services fees) as part of the implementation process. Thus, the payback for a doctor is now at least a year. We can take this one of two ways. One is that they wanted to accelerate their revenue growth and increase their win rate over competitors and view implementation revenues as far less valuable compared to the many years expected monthly revenue given the low historical churn. If this is the correct assumption, we would expect revenue growth to accelerate in the future. The more skeptical take is that competition forced them to lower implementation revenues and that this is the new paradigm of the cost of generating sales. It’s unambiguous to me that the NPV of a customer is worth far more than the extra couple thousand they may lose to get them started on the subscription. What is more ambiguous is whether this move was done from a position of strength or weakness. This certainly deserves to be monitored closely as a risk as we hope to see an acceleration of sales from this tactic, but nonetheless this is one of the identifiable reasons that the valuation is depressed. The stock fell to $1.06 right after the second quarter when the “New Pricing Model” was first disclosed.
- Takeaway: Negative
|
Q2 2014 |
Q3 2014 |
Q2 2015 |
Q3 2015 |
|
|
Recurring Revenue |
4,675,460 |
5,022,278 |
5,638,786 |
6,017,723 |
|
Y/y Growth % |
20.6% |
19.8% |
||
|
Professional Services |
1,441,617 |
1,209,307 |
957,290 |
1,032,994 |
|
Y/y Growth % |
-33.6% |
-14.6% |
3. Anticipatory Hiring
- Takeaway: Positive
- Potentially derived from the second, the company had to spend money hiring in anticipation of more implementation activity. Checkley explained it this way on the call when asked whether they had ramped up implementation costs enough to handle their current implementation load: “The ramp up we had in client services is enough to handle the increase in sales. I hope I have that problem again, we increase sales, we’ll scale up the ops to match, but we don’t have any more significant costs to handle the current sales volume. You gotta make those investments as you get the sale, so you can install the backlog.”- Mike Checkley, Q2 conference call
- The backlog at the end of Q2 had ballooned to 200 doctors, not including any of the Jonoke doctors, so one can argue the lowered implementation pricing was already having its intended affect.
- We believe we have reached the apex of these margin dragging affects, and thus margin trough and margins will continue rising throughout 2016. A short term EBITDA target is 15%, and 20% should follow that as soon as Q4 2016, which is just a reversion back to historical levels for the EMR segment when it was smaller.
Another reason this opportunity exist- Lack of Investor Relations Effort or Investor Communication:
For months we struggled to get in contact with anyone at the company and elicit a response to requests for phone calls. Many investors we talked to were frustrated by management’s lack of transparency in giving out any kind of metrics to model or work with. Adding to this overall confusion and frustration were all the divestitures along with the company’s unwise decision in Q4 to combine all segment reporting into one segment for one single quarter right before giving away the RCM product. Very recently the Board asked for investor feedback on KPIs and its obvious they are making a more concerted effort to cater to institutional investors.
To summarize the improving optical set-up, from an investor’s point of view:
|
Pre-Divestitures |
Present |
|
|
Revenue Growth |
Negative |
Accelerating Growth Once Lapping RCM Divestiture in Q3, and Lapping “New Pricing Model” in Q2 |
|
Margins |
Deteriorating |
Improving due to restructuring completion and hiring in advance of growth |
|
Segments |
3, with weak segment masking EMR strength |
1, Pure-play, 86% recurring revenue, 98% customer retention, Previously achieving 20%+ EBITDA margins |
|
Corporate Governance |
Unfocused empire building, lack of major shareholder representation |
Activist board representation, New Chairman focused on profitable growth, aligned incentives |
|
Investor Transparency |
None |
New detailed KPI Reporting, Outsourced IR on the Horizon |
Management
The situation surrounding the new CEO, Mike Checkley, reminds us of the Merge Healthcare situation (perhaps this is saliency bias). Merge was trading at $2.00 in the middle of 2014, then got bought out by IBM for $7.00 a year later (see our VIC write-up). Like Justin Dearborn (now CEO of TPUB, of all companies), Mike was promoted from within after leading the core segement. He has a more technical background, so he understands the product very well. He is hungry and motivated with all eyes on him as a first time CEO of a public company.
We view the new Chairman of the Board, Neil McDonnell as a tremendous leader for the company. Asking around it is quickly revealed that he is a very hands-on Chairman and he spends several days a month at QHR HQ in the weeds on operational details. He is an operator by background and has previously exited six companies via sale (most recently sold Wurldtech to GE, TIR Systems to Philips, and MDSI to Ventix)
Activist Board Members: Activist shareholder Pender Funds (Dave Barr, Kelly Edmison) own 15.6% of the company. I believe this to be a ~6% portfolio position for them. The firm has an enviable, top-tier track record with a ~19% net CAGR since inception. The principals have Private Equity background and do deep due diligence. They state that they want to hire an outsourced IR firm within 1-2 years, but they are also quite open about ultimately guiding company to a sale to exit their stake.
Valuation
As stated with the QIS write-up, I have acrophobia so I look down before I look up. I want to get comfortable with the specifics of downside protection and price targets but am okay with ambiguous upside. To emphasize the downside protection we run QHR through the same theoretical “run-off” valuation.
For a recurring revenue business like QHR, we can look at the current customer base and try to understand the cash that the company could throw off if they decided to go into run-off mode and harvest the customer base. This usually leads to a deeper understanding of cost structure and operating leverage, as well as provide an understanding of downside and what an acquirer might pay for the company. We’ve come to the conclusion that a low churn, high gross margin company should trade above 2x recurring revenues, and most of the time significantly above that, because of the high implied run off margins.
With QHR what we have is a slightly bloated cost structure given the divestitures (which management admits and has resulted in the restructuring) combined with increased demand for the product, which is leading to higher acquisition costs (hiring in advance of implementations).
Management gave us a framework to work with, namely that going forward it will cost ~$6,000 to acquire and implement a doctor, and that the net cost will be closer to ~$4,000 since they expect to recoup $2,000 per doctor in professional services revenue, so if the company were to decide to go into run-off mode, they could eliminate not only the $6 million in explicit acquisition costs, but could pair down R&D, S&M, and G&A by at least a million dollars each. We get to a 44% run-off operating margin. From there, we use 2% annual churn, $500,000 of annual maintenance cap-ex, a 20% tax rate and a 9% discount rate to get a NPV of $84.3 million or $1.66/share (23% of upside).
Keep in mind this target price is more of a hypothetical exercise, but is meant to guide thinking about downside as well as minimum takeout price.
Trading comps are just silly, with 375% upside to our peer group’s average 2017 EV/Recurring revenue multiple of 8.7x (and 200%+ upside to comp median multiple of 6.0x).
|
|
|
2015-2017 Estimated CAGR |
|
|
2017 Multiples |
|||
|
Ticker |
Company |
Sales |
EBITDA |
EBITDA Margin (2017 Est.) |
% Revenue Recurring |
EV/Sales |
EV/Recurring |
EV/EBITDA |
|
CERN |
Cerner |
12.2% |
17.6% |
36.2% |
21.0% |
4.2x |
19.9x |
11.6x |
|
ATHN |
athenahealth |
22.0% |
21.3% |
19.2% |
75.0% |
4.5x |
5.9x |
23.1x |
|
MDRX |
Allscripts |
5.0% |
15.6% |
20.9% |
34.0% |
2.1x |
6.0x |
9.8x |
|
CPSI |
Computer Programs |
7.5% |
47.5% |
32.7% |
40.0% |
2.1x |
5.3x |
9.4x |
|
DSG |
Descartes |
12.3% |
15.5% |
34.5% |
93.0% |
6.4x |
7.8x |
18.5x |
|
ESL |
Enghouse |
16.0% |
17.3% |
26.0% |
48.0% |
4.9x |
11.8x |
19.0x |
|
QSII |
Quality Sys. |
8.6% |
15.0% |
17.7% |
34.0% |
1.4x |
4.1x |
7.8x |
|
Comp Average |
11.4% |
16.0% |
25.3% |
49.3% |
3.6x |
8.7x |
14.2x |
|
|
Comp Median |
12.2% |
15.6% |
22.6% |
40.0% |
4.2x |
6.0x |
11.6x |
|
|
QHR |
QHR |
18.8% |
93.5% |
20.3% |
87.0% |
1.6x |
1.9x |
8.1x |
|
Difference b/w Avg. |
7.4% |
77.5% |
-5.0% |
37.7% |
-2.0x |
-6.8x |
-4.4x |
|
|
Difference b/w Med. |
6.6% |
77.9% |
-2.3% |
47.0% |
-2.5x |
-4.1x |
-1.9x |
|
|
QHR Upside to Avg: |
125% |
357% |
75% |
|||||
|
QHR Upside to Median: |
162% |
217% |
43% |
|||||
QHR is growing both revenue and EBITDA (off a low base) much faster than selected trading comps.
If looking at just organic growth, then QHR’s sales growth rate is even more impressive relative to these trading comps.
Many of you may be familiar with the Canadian comps, ESL.to and DSG.to. They trade at 8x and 12x recurring revenue, respectively. This equates to ~18-19x forward EBITDA. Once the market decides these software companies are high quality, steady growth, cash flow machines they get very high multiples. The Canadian comps highlight that there is no “structural discount” for Canadian software companies. Certainly QHR is the smallest and gets a liquidity discount, but as the company grows, and hopefully the market cap grows and trading volume picks up early investors get the capitalize on that multiple expansion as the liquidity discount is removed. The underlying business is every bit as high quality as the Descartes and Enghouse businesses and margin potential is just as great.
Nightmare trading comp: Nightingale
We have a nightmare scenario sitting in front of us now with Nightingale that we can stress test QHR’s valuation against. There are a ton of moving pieces at Nightingale, but they appear at very high risk for bankruptcy, as they lost over $4 million in FCF last year, have $13 million in debt (versus $800k in cash), and had to sell off 35% of their business recently to fund needed debt payments (as well as do a costly convertible debt deal). It is my understanding that they had major delays in their recent product release, which has resulted in some customer defections, but also very large spending on capitalized software costs ($4.7 million in FY 2015).
With all that said, we have calculated the pro-forma EV at about $10 million, and the pro-forma recurring revenue run rate at about $7.5 million, yet is flat and has been slowly declining for five years. About 84% of their revenue is recurring. Even with all of these issues and possible bankruptcy looming over it, the company trades at 1.33x recurring revenues, providing us an extreme downside scenario for QHR which exhibits none of the distress that plagues Nightingale.
QHR has no material debt and has a nice cash balance, the recent cash burn does at least allow us to contemplate a nightmare scenario like this. At 1.33x 2016 recurring revenues using our bear case numbers, QHR would trade at $.86, or 36% downside from current levels. This is highly unlikely and is a level where I would gladly be “backing up the truck” and increasing my concentration in the stock.
Ultimately Nightingale could offer a major opportunity for QHR, as a Nightingale bankruptcy or even hint of distress could pave the way for QHR to cheaply acquire another large group of doctors, but for now Nightingale is slowly bleeding customers and losing share to QHR.
Transaction Comps:
There are three recent transaction comps in the US that are worth noting, two of which are particularly relevant for QHR. Merge Healthcare was acquired in early August by IBM for about $1 billion dollars, or about 4x pro-forma sales, 7x maintenance/recurring revenue, and 16.5x approximate pro-forma 2015 EBITDA. Although Merge is larger than QHR, it is instructive as to what can happen when operational confusion subsides and investors step back in. As late as the summer of 2014, Merge was trading at $2.00 as they were dealing with all kinds of operational messiness, ranging from a plunge in license sales because of a SaaS transition and the ICD-9 deadline hurting sales as it shifted health providers IT focus to ICD compliance. Also the CEO had stepped down and at one point the company came dangerously close tripping debt covenants.
Like QHR, Merge had a highly regarded product (#1 in KLAAS for cardiology and radiology imaging), a communicative CEO (Justin Dearborn—recently appointed CEO of TPUB, of all companies) was promoted from within, they had restructured some and cut cost, and they exited a couple smaller unprofitable businesses. Within a few quarters of all of this, Merge’s EBITDA margins had risen dramatically, while revenue growth flattened out and ultimately went positive in the last couple quarters before being acquired. Savvy buyers had a triple with Merge around the time of the operational scare and the valuation paid by IBM is instructive for a stable niche leader within healthcare IT. Merge was pretty heavily levered and was growing under 10%, but it had a dominant position within its niche (radiology/cardiology). QHR is arguably in a better financial position with no debt, higher recurring revenue, a better market share position, and has much more greenfield growth opportunities than Merge does. If QHR today were acquired at Merge’s EV/Sales multiple, it has 80% upside. And to reiterate, MRGE had a lower percent of sales recurring than QHR does.
The next relevant transaction comp is MedAssets (MDAS), which was acquired on November 2nd. This is not as good of a comp, as its focus was revenue cycle management and growth had slowed to a crawl at less than 2% projected over the next several years. At 3.6x sales it is still very instructive to highlight the value we are getting in purchasing QHR at 2x.
Quality Systems, ticker QSII, announced they were purchasing HealthFusion for between $165 million and $190 million in all cash. HealthFusion is a cloud based EMR system in the US. While Quality Systems did not state this year’s revenue, they said they recently gotten “above $30 million annualized” in the most recent quarter with double digit sales growth. Taking the minimum purchase price at $165mm and dividing by $30mm implies an Enterprise Value to revenue multiple of 5.5x. However, there is a contingent earn-out of an additional $25 million if HealthFusion hits $43 million in sales next year, or roughly 43% revenue growth from the latest quarter run-rate. So if HealthFusion gets that additional $25 million earn-out and hits $43mm in sales, QSII is paying 4.43x Forward Sales. If QHR received 4.4x it’s latest quarterly run-rate of revenue, it would fetch a 90% premium from the $1.35 level.
HealthFusion is the perfect transaction comp because it is a subscription based EMR service for smaller doctor groups, just like QHR. Its revenue base of ~$30 million is exactly on par with QHR’s and the total doctors on the platform (6,000) is similar to QHR as well. The 5x+ multiple is an aspirational goal for QHR, and not our base case, but we do have several transaction comps in that range just in the last five months.
Worst Case Transaction Comps:
-
QHR’s Sale of own EHS Division at 2.0x Sales in 2013
- Revenue was less recurring, it was not growing, was near breakeven
- Fetched same multiple QHR EMR pure play is getting in the market now
- Computer Programs & Systems (CPSI) buys HealthLand
- Announcement date: November 25th, 2015
- No growth, structurally lower margin, lower recurring revenue as percent of total
- EV/Trailing Sales 2.2x (~ current market price for QHR)
- CPSI stock rose 25% day of announcement, thus the market viewed the deal favorably
-
Let me make another important point about this transaction and QSII’s of HealthFusion to give you a sense of the market’s reaction to these deal announcements. Despite the Healthland having no growth and no profits CPSI’s stock rose 25% the day of the announcement. CPSI now trades at 2.9x EV/Sales and 15x trailing EBITDA, much higher than QHR.
Some of the obvious potential QHR Acquirers include:
- Telus (T.to)
- Large US EMR players (CERN, Epic, ATHN, MDRX, QSII)
- Descartes Systems Group (DSG.to)
- Enghouse Systems (ESL.to)
- Constellation Software (CSU.to)
- Financial buyers (private equity)
QHR traded at >3x sales for most of its recent history before the operating confusion and obfuscation of the financial statements. If shares revert to just 3.25x our 2018 revenue estimate (which assumes a 14% revenue CAGR 2016-2018) the stock has 87% upside. This would be only a 3.4x recurring multiple, well below the trading and transaction comps.
Blue Sky Valuation Scenario
After speaking with management, several board members, and the largest shareholder, we believe the company aspires to double their doctor base and ARPD over the next 5 years. This would equate to a 5 year CAGR of 15% for both doctor growth and ARPD growth, and a 32% revenue CAGR, so we believe it’s unlikely but not entirely inconceivable. We see more obvious visibility for doctor growth than ARPD growth, but nevertheless believe both are a possibility as consolidation occurs and upselling opportunities increase with high margin subscription add-ons such as Medeo.
At the end of 5-years with a 30% revenue CAGR, an EV/EBITDA multiple of just 14x and an assumed 30% EBITDA margin, the stock would return 700%. At 14x this would still be at a hefty discount to other “high quality” Canadian software players like Constellation, Enghouse, and Descartes which all trade at 18-20x NTM EBITDA estimates.
I and/or others I advise hold a material investment in the issuer's securities.
Catalyst
- Improved investor relations effort
- Continued ~20% recurring revenue growth
- EBITDA margin and cash flow improvement becoming more obvious, attracting more buyers
- Buyout
- ARPU growth via Medeo and other subscription add-ons
| -1 show sort by |