| 2017 | 2018 | ||||||
| Price: | 38.31 | EPS | 3.99 | 4.09 | |||
| Shares Out. (in M): | 147 | P/E | 9.6 | 9.4 | |||
| Market Cap (in $M): | 7,022 | P/FCF | 10.2 | 10.5 | |||
| Net Debt (in $M): | 2,606 | EBIT | 794 | 785 | |||
| TEV (in $M): | 9,628 | TEV/EBIT | 9.7 | 9.8 | |||
Sign up for free guest access to view investment idea with a 45 days delay.
- None found
- BETA
- SLEEP NUMBER CORPORATION SNBR 08/21/2018
- CITI TRENDS INC CTRN 01/10/2019
- AMAZON.COM INC AMZN 05/02/2023
- Fast Retailing 9983 JT 10/12/2010
- EQT Corporation EQT 09/11/2020
- WH Smith SMWH S 04/11/2013
- Tesco plc TSCO 04/05/2011
- SAINSBURY (J) PLC JSAIY S 11/11/2016
- THRYV HOLDINGS INC THRY 02/17/2023
- Travis Perkins TPK.L 02/25/2017
Description
Warning: Company has numbers tomorrow morning. They have not had a great track record in the last year or so with reporting, so this may turn out to be the worst-timed writeup in the history of VIC, however wanted to post it as soon as I finished writing.
Next Plc
Company In Numbers

Guidance

Brief Investment Case
-
Best in class UK retailer with mid to high 20’s ROIC and strong, stable free cash flow
-
Well regarded management team with skin in the game (CEO owns £60m of stock)
-
Difficult macro environment and series of profit warnings has seen share price halve
-
Sentiment has gone from extreme optimism (17x EPS) to extreme pessimism (9.7x)
-
Market too concerned on Retail LfL; predicting doom for Directory after one bad year
-
Business model not broken - stabilisation in next 12-18 months will see multiple recover
-
Supported by strong cash generation (10% FCF yield) and relatively good balance sheet
-
Return of share buybacks should drive EPS recovery and put a floor under the shares
-
Upside to fair value of ~40%
Company In Brief
They are a UK-focused (90% of sales) retailer of clothes and homeware, with clothing being about 85% of sales and homeware about 15%). Sales densities in clothing are slightly higher, so about 75% of retail space is for clothing and 25% for homeware.
Next came into existence in its current guise in the early 80s, with the first Next-branded womenswear store being opened in 1982, and menswear being added a couple of years later. From the mid 1980’s onwards, the pace of expansion quickened and the brand diversified. With the exception of a difficult period in the late 80’s/early 90’s, the space expansion continued at a pretty steady pace until now. I am deliberately glib in describing 20-25 years of the company’s history as “steady expansion” as, by and large, the corporate history has not been particularly exciting, without many large deals or dramatic episodes.
The only really dramatic events would be a near-bankruptcy in the late 80’s, which was as a result of rapid expansion ahead of a dramatic fall in consumer spending after rates were raised. The company had diversified into various diffusion brands, which left the consumer a bit unsure as to what the core offering was, and had taken on quite a lot of financial leverage to drive the expansion. As a macro slowdown coincided with some company-specific issues over brand, disaster nearly ensued. The CEO, George Davies, stepped down, with his deputy, David Jones, stepping into the hot seat. The company was successfully restructured and debt paid down.
Probably the other notable thing in the corporate history would be the accession of Simon Wolfson, the current CEO, into his position in the early 00’s. It was seen as a controversial appointment at the time, as he was only in his early 30’s, and was the son of the then Chairman. Actually people needn’t have worried, and investors have done well under his stewardship. The two key tenets of his strategy have probably been the pursuit of space growth (only at attractive returns), together with the return of excess capital in a shareholder friendly manner.
The quite high long-term growth rate in space has meant that sales densities in the box retail business have been declining since the mid 00’s (as have LfL sales in this part of the business), but in fact the space growth has created economic value, as the company are quite strict in terms of ROIC and cash payback periods for new space. Furthermore, the store network is supportive of the online (they call it Directory) business, as a branch network of >500 stores is quite convenient for click and collect type business (as long as you order stuff online before midnight, you can go and pick it up from the store closest to your work, for free, the next day).
UK Retail Market & Next
According to Planet Retail, The total UK clothing market size was about £58bn in 2015, which compares to total UK retail sales of £358bn and consumer spending of just over £1trn. The womenswear market is about twice the size of menswear, while online was just over 20% of the total.
In terms of competitive environment, depending upon which data one consults, Next is either number 1 of 2 behind M&S, with a share of about 7%-8%, ahead of Primark and Arcadia (5% each). Until a few years ago, the company had steadily taken market share in UK clothing, both as a function of their own space growth as well as key competitor M&S’s long-running issues.

Their market share is down from the peak, which I think is as a result of the overall trend of increased market fragmentation as the rising importance of online has further lowered barriers to entry - in 2006, the top 5 apparel retailers had 38.5% of the UK market; by 2015, the number was down to 31.5%.

The key trend in the industry overall is of course the shift of clothing retail online - in 2011, 11% of UK apparel sales were online; in 2016 the number was 23% - adapting to this change has been the main strategy consideration in recent years.

This trend has shifted the goalposts slightly in terms of the right metrics to use to analyse industry players – whereas 10-15 years ago one would have been mainly focused upon space growth, space density, LfL growth and so on, I think that many would agree that these metrics give a much less complete picture in 2017, and it is now as important to focus on “overall LfL” (so some companies will give you a LfL figure including online sales, which Next does not do), quality of the mobile offering (mobile conversion rates, app ratings, ability to shop omnichannel in a seamless way), and quality of distribution (availability and cost of next day delivery, tightness of delivery slots), to name a few.
Next have a market share of about 4% in homeware, with the leaders being Dunelm and John Lewis with about 7.5% each. Ikea then have about 5%, while Next and Argos have about 4% each.
In their Directory business (the online part of the business, which they report separately), the largest catalogue competitor is Shop Direct (Littlewoods) with 1.8bn of sales; the largest pure play clothing retailer is ASOS with 1.9bn of sales (but 55% of that is outside of the UK), while Amazon is also growing in clothing and homeware.
In terms of what drives overall apparel and homeware demand, the following schematic from a broker is quite helpful in terms of laying out the main drivers.

UK real household disposable income is clearly an important driver, together with consumer confidence (with the two factors of course closely linked).
In terms of the first part, real disposable income, UK real average earnings growth has been quite muted for a number of years. It is currently back into positive territory thanks to a slight uptick in nominal earnings growth, together with falling CPI. Given sterling moves post-Brexit, however, we are already seeing CPI pick up meaningfully, which is expected to accelerate into this year. This is likely to put pressure on disposable incomes, and indeed many of the UK retailers have seen their share prices suffer on the back of this, with Next pointing to tough times ahead:

In terms of consumer confidence, it has held up reasonably well. After a lurch lower post-Brexit, the world continued to rotate on its axis and consumers went back to spending. Without getting into politics, it is perhaps not that surprising that consumer confidence held up okay after Brexit, given that the majority of people got what they wanted.

One interesting point to note is that with real earnings growing in 2016 and consumer confidence holding up reasonably well post-Brexit, consumer spending also held up quite well, particularly in the back half of the year. Nevertheless, spending on clothing and footwear did not hold up well at all – it is a little bit of a conundrum as to what exactly is happening, but it seems like people are maintaining their spending on “experiences” (i.e. going out, holidays) and cutting back on “things”. This view is validated by the commentary of some of the airlines post-Brexit, with easyjet noting recently that the yearly holiday seems to almost be the “sacred cow” for the UK consumer.

Next Detail
The two key reporting units of the business are Retail and Directory, with Retail being the physical stores, Directory the online business. These two units are £4.1bn of the £4.2bn of group sales, and 780m of the 830m of group EBIT; the 50m discrepancy is their Sourcing business, which is a separate reporting unit tasked with sourcing fabric and making product, from which Next sources about 40% of their overall product. The division has 700m of revenues, all of which represent a group elimination; hence the sales only show in the segment reporting.
Retail revenues are £2.4bn vs. Directory at £1.7bn, but operating income is slightly higher in Directory (£430m vs. £350m in Retail). Product margins are about the same in the two divisions, but Directory benefits from having about 2.5m credit card customers paying ~21% APR on credit balances, which adds about 800bps to the divisional margin after credit costs.
The group generates operating income of about £830m on sales of £4.2bn, which translates to net income of ~£630m and free cash flow of ~£560m on a market cap of £5.7bn and a lease-adjusted EV of ~£7.8bn.
Financial Summary
The medium-term financial performance of the two divisions is summarised below (more detail in later sections)

The strong growth of the Directory business has driven overall group revenue +24% from Jan 10 FY to Jan 17E FY, while the better profitability of that part of the business has meant that operating income has grown 60%; a declining tax rate (UK corporation tax was reduced over the period) meant that net income grew 83%, while steady share buybacks (27% of shares retired over the period) have seen EPS grow ~150%:

In terms of the buybacks, over the last eight years, 91% of the free cash flow has been returned to shareholders via buybacks and special dividends. The split between the two is dependent upon the company's equivalent rate of return calculation.
The ERR calculation they make is to take a notional buyback amount and calculate EPS enhancement from that level of buyback. They then compare that to the return they would need to generate from capex of the same magnitude as the buyback in order to generate equivalent EPS growth. As an example, at the current market cap of £5.7bn, if they were to do a £250m buyback, that would be 4.6% EPS enhancing – 1/ (1 – (.25/5.682)) – 1. Given consensus profit expectations of ~£829m, they would need to add about £829m * 4.6% = £38.2m to generate the same EPS growth in the absence of a buyback. Given a notional £250m buyback, that would mean they would need to generate a return of £38.2m/£250m = 15.3%.
The buyback would thus look attractive to them as they would need to generate a mid teens return (after tax) on an investment to get higher EPS accretion. The company have said in the past that, provided the ERR relative to a buyback does not drop below 8%, they would be buyers of the stock. In “steady state” times, this commitment is obviously supportive to the shares as it sets out a clear level at which the company will be buying stock in the market.
The simplified cash flow statement and drop through of free cash flow to shareholder returns is summarised below:

While shareholder returns have been fairly high relative to FCF in the past, and I expect that to be the case again in the medium-term if they can negotiate the current difficult period, the policy of high shareholder returns has not left the balance sheet in bad shape, with net debt/EBITDA expected to end the year at 0.9x, which would be about 1.7x on a lease-adjusted basis, capitalising the operating leases at 5x the Jan 17 FY rental charges of £230m:

The company is led by Simon Wolfson, who has been CEO since 2001; the shares have risen ~900% over his tenure, an IRR of about 15.3%; he owns about 1% of the company, hence has ~£60m of his own net worth directly aligned with other shareholders.
Despite the current pressures on profits, the company enjoys good margins and exceptional return on invested capital, creating significant value for shareholders. The chart below only includes the recent history, but the overall trend is similar going all the way back to the late 90’s/early 00’s. I estimate that total economic value added by the company over the last 20 years is around £5bn:

In the next sections, I will discuss the main reporting divisions in a little more detail.
Retail
Overview
It is kind of a misnomer to look at the Retail and Directory businesses in isolation, as there are benefits from them existing together, but I will try to lay out the key characteristics for the sake of clarity, given they do report them separately.
The estate consists of about 540 stores across 8m sq ft. Average store size is about 14,800 sq ft, about 25% above where it was five years ago, while sales densities are down over that same period in the high teens percentage. This is a function of both declining LfL and a weighting towards space growth in homeware, which has lower sales density vis-a-vis clothing.
The Retail business will probably have sales of about £2.3bn in the January 17 full year, with operating income of £402m for a margin of 14.7%. Margins have been as high as 16.7% but will decline in the Jan 17 FY, and again in the Jan 18 full year. Sales are about flat to slightly above where they were a few years ago, however space has grown about 3% pa so the LfL trend has been consistently negative.
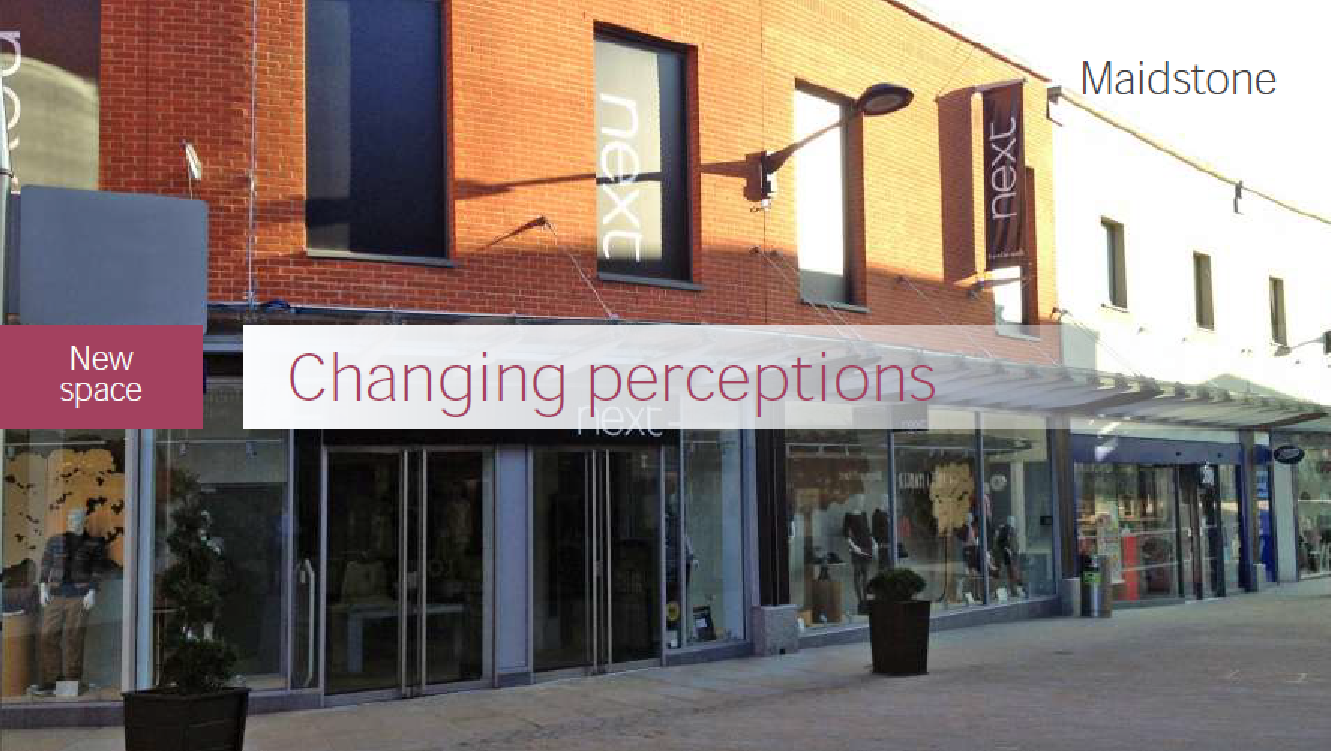
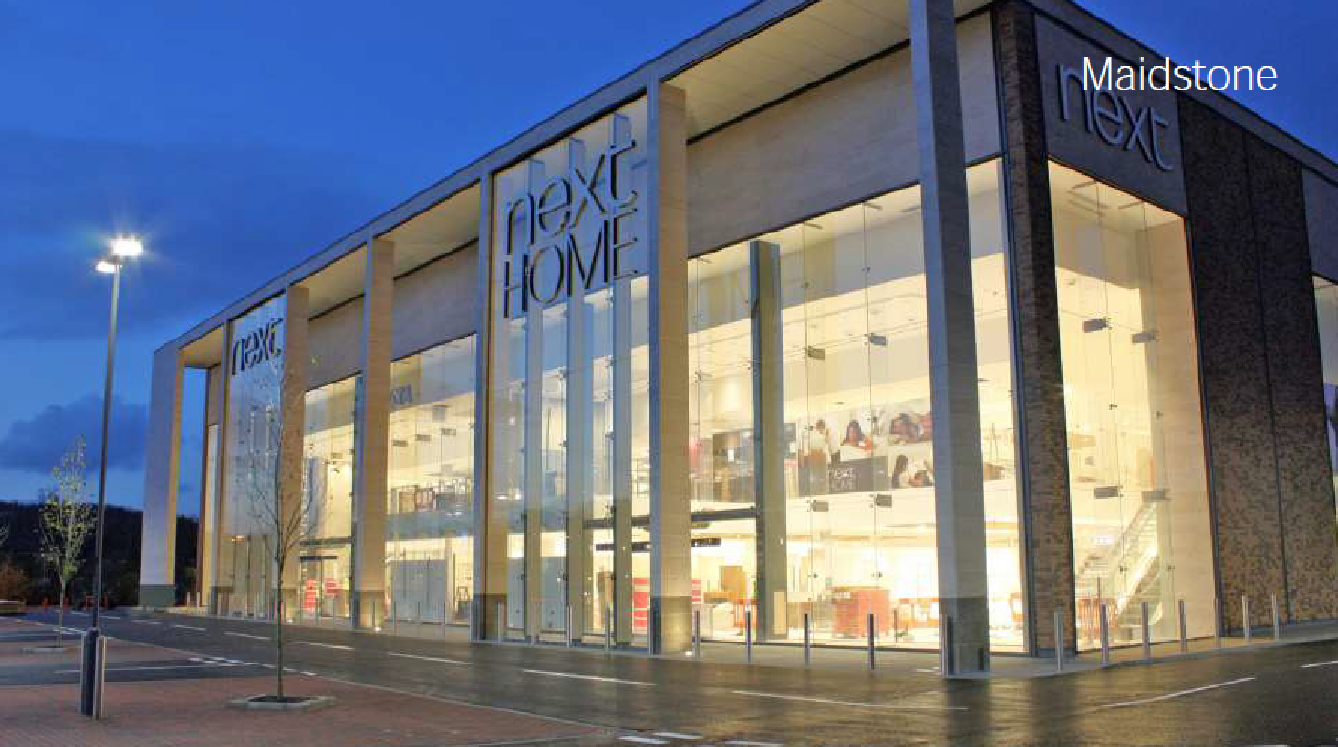
The overall strategy in Retail has been to expand space reasonably aggressively with a slight shift in the portfolio away from smaller high street locations to larger, out of town “destination”-type locations – by this I mean that they will combine clothing and home space, sometimes building themselves from scratch, make the locations higher spec (natural light, nicer materials and presentation) so it does not feel as dreary to walk around there, have a Costa franchise on site so that if the wife wants to make a morning of the trip on a Sunday, the husband can at least sit in the coffee shop with a cup of tea and the Sunday papers (apologies for the vague sexism), etc. One example of many that they give is a new build in Kent, in the south of the UK:
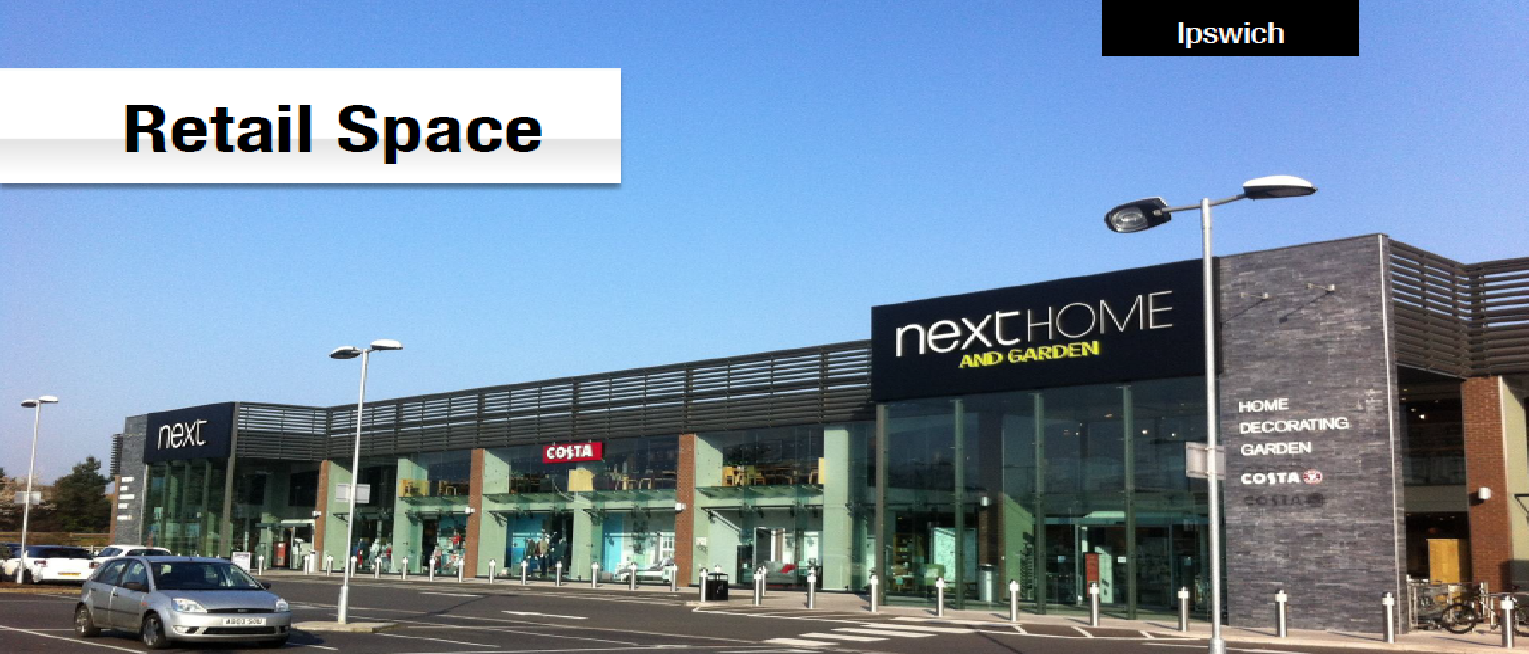
This is another store in Ipswich (south east of the UK, about 30km from where I live, actually), where you can see the coffee shop plonked in the middle of the outlet:
The company have been fairly stringent in terms of the hurdle rates for investment, so in spite of the fairly dire pronouncements from all and sundry on the state of UK non-online retail, these additions to the estate have by and large created value for shareholders. New space has to beat an internal investment hurdle of 15%, with a capital payback of no more than 24 months; over 75% of the stores have profitability above 20%, while 97% is double digit and almost nothing is loss making.
Interpreting these numbers is of course a matter of one’s disposition towards the investment case. Bulls interpret it as the management showing capital discipline, while the bears tend to use it as evidence of the company over earning.
As well as being as aggressive as they can regarding new space, the company have also been fairly proactive on refreshing the footage they already own to keep it from looking tatty and dated, but I think that is probably just a cost of doing business rather than growth capex per se – the following slide from a few years ago gives a rough feel of the split between “growth” and “maintenance”:

The other element of the Retail strategy I wanted to touch on is more emphasis on short lead times from design to getting product in store. Traditionally the company has bought a large amount of fabric ahead of season and produced in large runs to ship in at as low a cost as possible. It is good for margins (in the absence of large fashion misses) but means they are less able to take advantage of mid-season trends. They are trying to be more dynamic and get products from the design team to stores in weeks rather than months, a la H&M/Inditex. It is a fairly large cultural change for them, but they have provided some qualitative guidance that thus “short game” product will represent an “increasing percentage” of Retail sales.
Probably the key issues for the Retail business going forward would be continued sales density/LfL pressure, input cost inflation as a result of GBP devaluation, and finally wage pressures as a result of the UK government’s so-called Living Wage Premium. I will briefly describe the issues below, and then try to address the issues later in the report.
Sales Density/LfL
Retail LfL has been pressured for the last decade – they reported strong LfL in 2005, but since then it has been down every year but one:

It is seen as a problem as LfL growth and density are still metrics that many retail investors are quite focused on. In terms of profits, obviously if LfL trends are weaker than expected then the company wind up with more inventory at the end of the season that they have to push through the channels at a discount, which is dilutive to margins. This issue was brought into focus in the most recent profit warning from January, where the company was lapping quite easy industry comps and still pointed to a tough environment, surprising many.
Input Cost Inflation
Briefly speaking, they report in GBP and source their product in a variety of currencies that are not GBP. COGS are about 65% of sales. It is not as simple as looking at the move in EUR or USD against GBP, taking account of the gross margin and then using that as the eventual headwind, as they source in nine or ten key currencies (an numerous smaller ones), not all of which have moved as meaningfully against GBP as the main crosses, while there is also stuff they can do regarding moving sourcing between various countries to better manage the headwind. All the same, the headwind they face is probably about 5% per annum:

In terms of what to do about this, they can either take the gross margin hit or pass on the costs via price increases – the company have signalled that they are going to take the latter option – they estimate the price elasticity of demand to be about 1.1 (in line with previous such episodes), which would then obviously make for a headwind on LfL growth over the next year or two. The concern that I think people have is that, looking at the numbers the company reported in January (they said that full price sales from 1st November to 24th December were -0.4% YoY when they had previously expected sales to be up), potentially there could be some kind of brand issue and perhaps the elasticity might be higher than
Wage Pressures
The living wage premium (LWP) is basically a minimum wage. Wages are about 15% of sales (so about £600m), and of the amount, £100m would be subject to LWP – from 2016 to 2020, the company estimate that the mandated increases will cost them £11m, however they will need to raise wages across the board to maintain differentials between the associates who will get the bump, and the supervisors, junior managers and so on. That will cost another £16m, so the total cost over four years will be £27m, or £6.75m pa, which is about 30bps on Retail revenues.
Margins, Summary & Expectations
In terms of the numbers behind the business, I have summarised the historical ones and my estimates below:

If I look at the margin trajectory over time, the 16.7% they reported in Jan 16 FY was the highest since at least 2010, where they reported 14.2%.
In terms of where the improvement came from, it was almost entirely through improvements in bought in gross margin (250bps) and less stock going through markdowns (80bps), so a better mix of full price sales. These two improvements are really better purchasing, some currency, some mix (gross margin slightly higher in home vs. clothing), and then a more intelligent use of the network (both Retail and Online) to liquidate stock, so that one does not need to take a large haircut to push it all through the store network.
Lower freight and fabric costs added about 50bps, while occupancy costs were a 100bp headwind. Rental costs per sq ft have declined a little, as UK retail space is more of a buyer’s market these days, but the decline did not match the LfL sales decline over time, so there has been a margin impact. The maturity profile of the lease portfolio has meaningfully improved in recent years (median lease duration gone from ten years in 2008 to six years in 2015) which should put them in a better position to bargain going forward:

Everything else is basically a wash.
For the year ending Jan 17, I have the margins down 190bps YoY, basically consistent with the group guidance they gave back in January. The margins were -250bps at the H1 stage but there was more of a headwind for declining full price sales in H1, so I think the FY estimate I have is probably about right.
In terms of what I have going forward, I have LfL -4% in Jan 18 FY, reflecting a slightly worse than “average” trend as the market digests the price increases. They should continue to add space (planning permission permitting) as guided, which makes the reported sales declines lower.
I have freight and fabric as a 190bp headwind on margins, then bought in gross margin +140bps to reflect the price increases, and finally markdown and slippage -70bps. These three numbers are basically my estimate of the net impact of purchasing costs in GBP going up, prices being hiked to offset, and volumes declining and more having to go through the sales.
The other main drivers are payroll, which I have as a 30bp headwind (LWP as discussed above) and occupancy costs, which is again rent on a unit basis not falling as fast as LfL.
Overall, I see margins down another 160bps in Jan 18 FY to 13.2%. As the residual raw materials impact hits the P&L in Jan 19 FY, I see margins down another 100bps; from there I have margins continuing to decline about 60bps YoY as a result of wage costs and rental costs as previously described. I think these are pretty conservative estimates on the margin side, as historically the company have been able to find efficiency gains, while I think that there are probably benefits to be had on the rental side, as we are not in the seller’s market for rental space that we were 10 years ago – they should be able to negotiate some favourable deals.
There is a perception in the market that the Retail business has been over earning over the last few years. I think that may not be an entirely fair accusation as I don’t think it is exactly certain that there are brand issues or that growth is not sustainable, but I tried to model a base case that reflects those concerns, still implies upside to fair value (which I discuss in a later section) and leaves me some room to upgrade my estimates if the scenario turns a bit more benign with the passage of time.
Directory
Overview
The Directory business is the online retail part of the business. It should report about £1.75bn of sales in the Jan 17 FY, up from £1.66bn in Jan 16 FY, of which about £220m will be international sales, the rest UK. The operating income should be around £430m, up from £405m in the Jan 16 FY. The margin of ~24% is thus well above the Retail margin of 16.7% last year.
The main reason for the difference in margin is that the Directory business has a large credit element – last year they did £1.24bn of sales on credit with 2.6m Next credit account customers at year end, and credit balances of almost £900m. Interest rates on those balances are 20.5% (used to be 22.5%), which added about £190m to operating income, about 11% on the margin; allowing for credit costs of 3%-4% as occasionally referred to by the company, that explains the difference in margins. My best estimate (company does not give this level of granularity in their reporting) on the divisional income statement, together with my forward-looking estimates (which I discuss later) is as follows:

The strategy of this division and the financial history are quite different to the Retail division. Aside from the higher profitability, it has had a much stronger growth profile, growing at a CAGR of 10.9% since 2011, of course driven by the tailwind of retail migrating online. The overall divisional strategy has been to seek new avenues for growth (such as International and Label, which I discuss below) and to improve the user experience.
In terms of International, it should be about £220m of sales in the Jan 17 FY, and around £40m of operating income; it has grown rapidly, more than doubling in size since the Jan 14 FY. The strategy there is really just to roll out a clone of the UK website into various foreign language equivalents with the option to pay in local currency. Delivery times are slower than the UK, however, as they lack the distribution capability that they have here.
The Label business is their attempt to sell non-Next brands via their distribution network – they do it via a separate tab on the website, together with a dedicated Label catalogue. Brands include Mango, Coast, Superdry, Barbour, Adidas, Nike, Ted Baker, and Hugo Boss, amongst others. The thinking here is that these brands would not really be willing to be distributed in the main Next catalogue as it dilutes their brand DNA, but if there is a way to do it that is ring fenced from the core Next brand, they are willing. That business has also grown fast, from £90m in Jan 14 FY to what should be about £210m in the Jan 17 FY – operating income would be about £25m.
Mobile Experience
In terms of improving the user experience, the way that people consume their offering online has changed quite significantly over the last few years. In 2010, 95% of sales were via the desktop site, 87% of orders got sent to people’s homes and nearly 90% of people received the Next Directory (the book mailed out to people with all of the collections). Fast forward to 2015 and only 37% of sales come from the desktop site (vs. 36% from tablets, 27% from mobile devices), while only 45% of orders are sent to people’s homes, and only about half of people take the directory.
This shift in consumption patterns has presented some unique challenges. Next have traditionally been better than most competitors in terms of logistics (delivery cost and time), but their user experience is probably not as good as some competitors in terms of look and feel of the website, app rating, live chat functionality, product detail, personalisation, and so on. This is partially reflected in the lower conversion rates from their mobile site vs. the desktop site:

This slide is actually from about 12-15 months ago, before they launched the dedicated mobile site (after which the conversion rates have edged up to about 6%). Nevertheless, the company acknowledge that it will probably be a multi-year project to get the mobile site to the level of functionality that they want.
Delivery
In terms of delivery options, Next are probably still the best, though the others are gaining ground. The following slides from a recent Jeffries report benchmarks Next against the main competition on a number of different metrics, all of which Next scores well on:


Credit Customers
Probably the other key discussion point in the Directory business is the impact of declining credit sales on the top line and then the margin. Briefly, the company have about 2.5m credit customers with a total Next card balance of around £1bn – at current 20.5% APR on the card, it is a profitable piece of the business for them. Previously, they made it hard to buy stuff on the website using a credit card issued by your bank – you would need to sign up for a Next account. Obviously that is a fairly unique approach and times have changed, and they now have to accept people using other credit cards, which they term as “Cash” business.
As this has been implemented, cash customers have grown from 267k in 2011 to about 2.3m this year; meanwhile, credit customers rose from 2.5m in 2011 to 2.8m in 2014 but have been declining ever since then. The annual decline has (hopefully) stabilised at about 4% and they should end this year at around 2.5m credit customers. I have modelled 3%-3.5% annual declines thereafter.
The credit customers that have remained have tended to be the higher value, stickier customers, but the concern people have is that this churn has meant that the average balance on credit customer accounts has almost doubled in 3-4 years, from £231 in Jan 13 to £403 as of July 16:

The logical fear is that this type of growth will be unsustainable going forward as most of the lower-value accounts have now dropped out and the remaining consumers are the “like for like” ones, who are unlikely to be growing credit balances any higher then low single digits, given the pressures on real disposable incomes alluded to in the discussion above.
If average balance growth moderates to, say, 2% per year, while credit customers are declining 3%-3.5% as above, then of course interest income is going to decline, which people are concerned about.
Forecasts
I have Directory revenues growing 5.1% in Jan 18 FY to £1.85bn, then 3.8% growth in Jan 19 FY to £1.93bn and finally 2.5% growth in Jan 20 FY to £1.97bn. For reference, the growth rates in the prior three years were 12.5%, 12.9% and 9.1%, respectively. The reason for the slowing overall growth is just the law of large numbers in the International and Label businesses. They have grown, combined, from £200m in Jan 14 FY to about £430m in Jan 17 FY – I think it is realistic to assume that these businesses continue to grow, but at a slower YoY rate.
I have modelled operating margins compressing by about 40bps per annum. The assumptions behind that are that credit customers will continue to fall by about 3%-3.5% per annum, however cash customers should still continue to grow in the mid single digits. I have modelled average account balances per credit customer only rising by about 2% per annum going forward, vs. the double digit increases we have seen in recent years. I think that this is a conservative assumption, as some of the dynamic in play in recent years (lower balance customers exiting) is probably still going to be in play, just to a lesser extent.
From here, one needs to make some assumptions on the relative profitability of cash vs. credit – the company guided in the past that the margin differential is only about 200bps, as while they miss out on 800bps of interest income, the make back 200bps from not sending out catalogues to the cash customers, and another 400bps from the fact that cash customers tend to have far lower return rates, as per this company slide from a couple of years ago:

In terms of the credit business, my core assumption is that the product margin is about in line to slightly below what they report in the retail business (where I have margins declining YoY as per above); I then add 8% of revenues to the operating income for interest income, and subtract about 5% for credit costs
From here, we can derive a pretty good estimate of what the operating income development should be like:

So I believe that they can continue to modestly grow operating income in the Directory business, despite a headwind from declining credit customers and more moderate growth in credit balances.
Investment Case
The basic case is that a run of bad news has damaged the aura of invincibility around the company and the stock has been heavily punished, but investors have now become overly negative and there is an opportunity for the patient investor to buy a high ROIC, cash generative business at a single digit P/E multiple.
Prior to the run of bad news over the last 12-18 months (a couple of profit warnings and the Brexit vote denting expectations), the company traded at a peak forward P/E multiple of about 17x, which was a premium to the FTSE of 15%-20% at the time. In terms of why there is an opportunity now, the shares have fallen peak to trough by 50% over the last year or so. That has been driven by a marked slowing in consumer spending on apparel in the wider economy, which seems to be driven by a preference for spending on “experiences” rather than "things". Concerns around Brexit did not really help, and with real income growth being pressured as CPI picks up, there has been some concern around the mid-term earnings outlook. Bulls thought that as we lapped the difficult apparel comps in early 2017, growth would improve.
Next, however, shocked the market by issuing a second profit warning in January, observing that there is some risk as far as they are concerned of the easy comps not really helping, warning of "tougher times" ahead. They issued cautious guidance for Jan18 FY of -1.5% full price growth at the midpoint, with PBT at -8%. Given the share price move, the market was also surprised by their decision to return excess cash via dividends. The share price is currently well below their ERR target explained above – the company justified returning capital via dividends by reference to the current very uncertain outlook, which I think the market took as a signal that they still didn’t think the shares look cheap.
In my view, the wider issue, or the latent fear that seems to have been crystalised by the two profit warnings, is that there is a structural issue with Next around increased competition, which will make it hard for them to push through the 5% price increases they need to do to offset their higher purchasing costs post the GBP devaluation. There is a school of thought that the company is overearning and that the weak LfLs and declining sales densities in the Retail business, which have been apparent for years, are a harbinger of a structural decline in profits. There have also been concerns over the sustainability of profits in the Directory business, as the company have been losing valuable credit customers to the faster growing (but less profitable) cash business (where they let people pay with non-Next credit cards).
As these fears have gradually (with a couple of sharp adjustments) come to the fore, the shares have suffered a fairly savage derating, with the share price halving from the peak and the multiple derating from 17x to 9.7x (dates on the chart in reverse order - sorry):

Meanwhile, five years of P/E premium building relative to the FTSE has been erased in just over a year, with a 20% premium turning into a 30% discount (dates on the chart in reverse order - sorry):

In terms of trying to address some of the concerns that people have around the company and why I think it is an opportunity, probably the main things people worry about are retail LfL trends, passing on higher input costs this year, wage pressures, and risks that their online offering loses competitiveness.
Sales Densities/LfL
Regarding the declining sales densities in the Retail business (56% of sales, 42% of operating income), where I have already referenced the declining LfL trends and the falling sales densities. I think that the concerns are a bit overdone. The company do not build out the space with the expectation that it will have positive LfL or improve densities. What they are doing is opening space that has a high ROIC and thus creates economic value for shareholders (which the space does), and also support the Directory business, which again it does, by providing a dense network of space to allow people to order online and then pick up the next day in store, free of charge.
To this end, I think it is useful to look at both the LfL of the Retail business and what I have termed the True LfL, which is the LfL in the Retail business plus the growth in the Directory business divided by the sum of the revenues in the two businesses in the previous period – the trend is much less negative:

I would also point out that while the structural driver behind the weak long-term LfL trend is the migration of sales online, a cyclical factor is consumer spending. As I pointed out in an earlier section, a huge gap has opened up between retail sales growth and growth in clothing and footwear spend:

As we enter the company’s H118 reporting (i.e. from calendar Q117), we start to lap a set of very easy wider macro comps, with expectations already reset low (hopefully) but cautious guidance (which consensus is slightly below the midpoint of), so actually I would not be that surprised to see LfL sales growth actually beat the guidance and consensus as the easy comp dynamic plays out.
Input Costs/Labour Costs
As laid out in the Retail section, they need to raise prices to offset input cost rises; previously when they’ve had to do similar actions to offset cost increases, you’ve see a price elasticity of demand of about 1.1, meaning the LfL headwind is likely to be at least -0.5%; on top of this, with real disposable incomes probably under pressure as inflation picks up post-Brexit, the risk is that the multiplier becomes much higher.
The first observation would be that, given the easy comps in clothing/footwear sales, perhaps there is some latent demand built up among consumers, and the elasticity may not be as large as people fear. The other observation would be sourcing costs for the company are about £1.6bn, so with 5% inflation, doing nothing would cost them about £80m, which is just under 10% of Jan 17 FY profit. I would argue that, unless the price elasticity of demand proves to be huge (i.e. above 2), taking a unit of price at a 100% drop through to operating income and sacrificing at least 1.1x that revenue at a drop through of only 35% (the group gross margin) is likely to be much better for the company economically, even if the analyst community fixates upon the LfL in the short-term.
Online
The concern here is that competitors are catching up to them on distribution, while the company still have a lot to do in terms of front end and user experience. I will not labour the issue and put all of the tables in here again, but consulting the section on the Directory business, I think it is clear that Next are still out on their own in terms of delivery speed, convenience and cost. While they do lag a little on the user experience, the data they have shows that conversion rates are rising, so I think there is evidence that they are doing a reasonable job in getting up to speed with competition, even if it will be a multi-year task. Consumption will also likely continue to migrate online, which should provide a modest tailwind for the Directory business. Basically I don’t think it is fair to ding them in the Retail business with really punitive LfL assumptions, and then assume a really abrupt slowdown in the Directory momentum, as really you are doing some double counting. I would also point out as a potential source of upside that while the International business in particular has grown fast and is likely to suffer from the law of large numbers, it is still a relatively small business with low penetration that is still building out distribution scale, so it could potentially surprise people to the upside.
Strong Cash Generation
One other key aspect of the investment case is that the company continues to be highly cash generative. The ~£800m of operating income that I expect them to generate in Jan 18 FY (which translates to £750m of PBT, towards the high end of the £680m-£780m guidance and 3% above the £730m consensus) should translate to about £750m of cash from operations. Tax of £150m will almost be offset by about £130m of D&A, while the slowing of credit sales in the Directory business means that the working capital investment in credit receivables that they have had to make in the last few years should tail off, which should be positive for cash flow. The company classifies interest payments (should be about £45m in Jan 18 FY) as a financing cash flow, but to me this is an operating cash flow, so I subtract this when estimating free cash flow. They then need to make pension cash contributions of about £30m per annum for the next 4-5 years to plug their deficit, while about £150m in capex (some of which on more logistics to support delivery both here and abroad, some on the online experience) should mean that overall free cash flow should be around £550m.
Given the market cap of £5.7bn and EV of £7.8bn, the free cash flow yield on an equity and EV basis would be about 9.7% and 9.5%, respectively. I set out my estimates of free cash flow in the table below:

I think that, as things (hopefully) stabilise into the Jan 18 FY, the company will feel confident enough to return to the policy of returning ~90% of free cash flow to shareholders. Given the current share price, I think that a decent chunk of this (~£300m per annum) will be done via buybacks. I think that this should mean that after a year of EPS decline in Jan 18 FY, the company should return to EPS growth in Jan 19 FY:

If my estimates prove to be right and EPS returns to growth, I don’t see the shares trading on a single digit multiple over the medium-term.
Valuation
In terms of what the shares are worth, my fair value range is 4450-6175, 15%-60% upside, which is 5300 (+38%) at the midpoint of that range. I value the company based upon target P/E, target EV/IC, target FCF yield and DCF.
The target P/E method uses a multiple of 10x Jan 19 FY EPS of 409p, which is where it can be expected to trade in January of 2018; I then add on the 176p of dividends that should be received between now and then to get to a fair value of ~4450p (15% upside). The 10x multiple is a 30% discount to the five year average forward multiple, so assuming my estimates are about right and the earnings do stabilise and the company commit to returning to buybacks at some point in the next year or so, I think the multiple can certainly go back upwards by a turn or two.
The target EV/IC method uses a target multiple of ~3.2x; I think this is fair, given I expect the lease-adjusted ROIC to stay in the mid-20’s; I am assuming a WACC of 8.3% and a terminal growth rate of 0.5%. I end up with a fair value estimate of ~6200 (+60%)


The target free cash flow yield assumes a fair yield of 8%, assuming that the company are able to keep free cash flow fairly constant, which I think they can; I think this is a more than fair multiple for what would be a steady company with mid-20’s ROIC. This approach yields a fair value of ~5000 (+30%).
Finally, with the usual health warnings around DCFs, I use a WACC of 8.3% and a terminal growth rate of 0.5% to deriva a fair value of 5600 (+45%):

Other Bull Points
The shareholder register is quite interesting – the sixth-largest shareholder is Woodford Funds – Neil Woodford was a star manager at Invesco, before leaving in 2014 to set up his own investment management company; Simon Wolfson, the CEO, is also in the top 20 shareholders, so he has quite a lot of skin in the game, with £60m of his own money aligned with shareholders.
It is potentially a classic case of consensus turning negative on the stock just when the bottom is in (famous last words), which potentially set up favourable risk/reward, i.e. the stock is likely to go up more on good news than down on bad news. It is anecdotal, but I note that only 4 analysts (out of 26 currently covering the stock) are bullish – this 15% ratio is the lowest since the end of 2013 (dates on the chart in reverse order - sorry):

I and/or others I advise hold a material investment in the issuer's securities.
Catalyst
No hard catalyst
| show sort by |